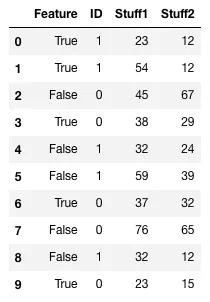
我有一个类似以下结构的DataFrame (mydf):
Index   Feature ID  Stuff1  Stuff2
1       True    1   23      12
2       True    1   54      12
3       False   0   45      67
4       True    0   38      29
5       False   1   32      24
6       False   1   59      39
7       True    0   37      32
8       False   0   76      65
9       False   1   32      12
10      True    0   23      15
..n     True    1   21      99
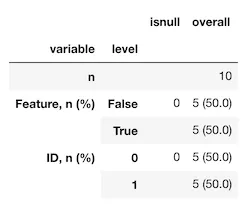
我正在尝试计算每个ID(0或1)的
Feature的真假百分比,并且我正在寻找每个ID的两个输出:Feature ID Percent
True 1 20%
False 1 30%
Feature ID Percent
True 0 30%
False 0 20%
我尝试过几次,但是我开始得到所有列的计数,然后是所有列的百分比。
以下是我的糟糕尝试:
percentageID0 = mydf[ mydf['ID']==0 ].set_index(['Feature']).count()
percentageID1 = mydf[ mydf['ID']==1 ].set_index(['Feature']).count()
fullcount = (mydf.groupby(['ID']).count()).sum()

print (percentageID0/fullcount) * 100
print (percentageID1/fullcount) * 100
我觉得我在groupby/index格式上有些混淆了。