我想要在R中制作像下图右侧所示的2D颜色渐变矩形。我该如何做?使用colorRamp或RColorBrewer或其他函数/包,我可以制作出漂亮的1D颜色渐变。但是如何在2D中实现,包括角落中的几种颜色,例如右上角的矩形?
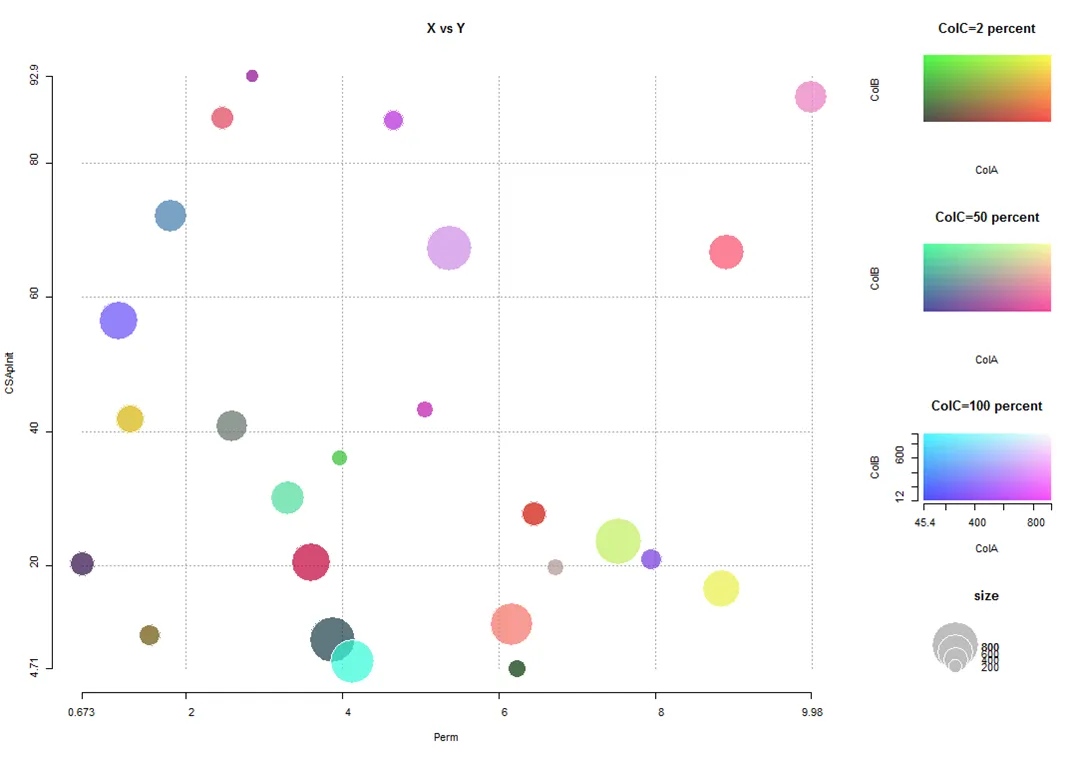
我想要的是以下两种渐变类型:

顺便提一下,我完全忘记了提到我在这里(由Luca Fenu制作)找到了上面的图表。
我想要在R中制作像下图右侧所示的2D颜色渐变矩形。我该如何做?使用colorRamp或RColorBrewer或其他函数/包,我可以制作出漂亮的1D颜色渐变。但是如何在2D中实现,包括角落中的几种颜色,例如右上角的矩形?
我想要的是以下两种渐变类型:
顺便提一下,我完全忘记了提到我在这里(由Luca Fenu制作)找到了上面的图表。
试试这个:
 m = tcrossprod(sin(seq(0,pi,length=1e2)), cos(seq(0, 3*pi, length=1e2)))
 cols = matrix(hcl(h=scales::rescale(m, c(0, 360))), nrow(m))
 grid::grid.raster(cols)
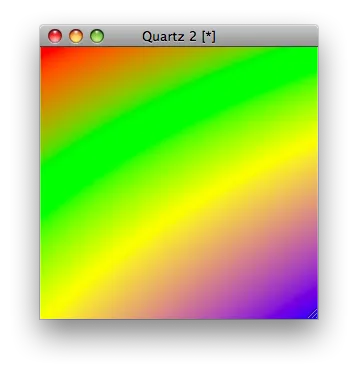
编辑:在4个角之间进行线性插值。
library(grid)
library(scales)

m = tcrossprod(seq(1,2,length=1e2), seq(2, 3, length=1e2))
pal <- gradient_n_pal(c("red","green","yellow","blue"), values = c(2, 3, 4, 6), space = "Lab")
cols = matrix(pal(m), nrow(m))
grid.raster(cols)
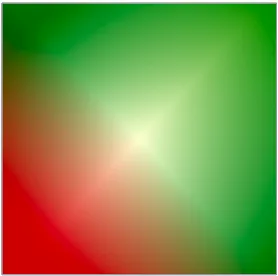
编辑2:当函数不可分离时,请使用outer函数。
fun_xy <- function(x, y){

  abs(y-x) * abs(y+x)

}

z <- outer(seq(-1,1,length=100), seq(-1,1,length=100), FUN = fun_xy)

cols = matrix(hcl(h=scales::rescale(z, c(0, 200))), nrow(z))
grid::grid.raster(cols)

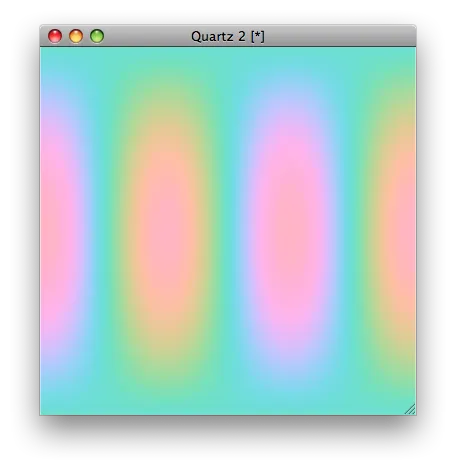
你还可以直接在函数内进行颜色混合,而不是事后将值映射到颜色比例尺上。
fun_xy <- function(x, y){

  R <- (x+1)/2
  G <- (1-x)/2
  B <- (y+1)/2
  A <- 1- 0.5*exp(-(x^2+y^2)/0.2)

  rgb(R, G, B, A)

}

z <- outer(seq(-1,1,length=100), seq(-1,1,length=100), FUN = fun_xy)

library(grid)
grid.newpage()
grid::grid.raster(z)

紫色,黄色,橙色和黑色而不是三个基本颜色,您将如何做到这一点?中间的十字对于映射非常有用 - 实际上,这就是为什么scale_colour_gradient2的mid=参数默认为'white'的原因。 - Anthony Damico#define extremes of the color ramps
rampk2r <- colorRampPalette(c(rgb( 0/255, 0/255, 0/255), rgb(218/255, 0/255, 0/255)))
rampk2g <- colorRampPalette(c(rgb( 0/255, 0/255, 0/255), rgb( 0/255, 218/255, 0/255)))
# stupid function to reduce every span of numbers to the 0,1 interval
prop <- function(x, lo=0, hi=100) {
if (is.na(x)) {NA}
else{
min(lo,hi)+x*(max(lo,hi)-min(lo,hi))
}
}
rangepropCA<-c(0,20)
rangepropCB<-c(0,20)
# define some default variables
if (!exists('alpha_default')) {alpha_default<-1} # opaque colors by default
if (!exists('palette_l')) {palette_l<-50} # how many steps in the palette
if (!exists('max_sat')) {max_sat<-200} # maximum saturation
colorpalette<-0:palette_l*(max_sat/255)/palette_l # her's finally the palette...
# first of all make an empy plot
plot(NULL, xlim=rangepropCA, ylim=rangepropCB, log='', xaxt='n', yaxt='n', xlab='prop A', ylab='prop B', bty='n', main='color field');
# then fill it up with rectangles each colored differently
for (m in 1:palette_l) {
for (n in 1:palette_l) {
rgbcol<-rgb(colorpalette[n],colorpalette[m],0, alpha_default);
rect(xleft= prop(x=(n-1)/(palette_l),rangepropCA[1],rangepropCA[2])
,xright= prop(x=(n)/(palette_l),rangepropCA[1],rangepropCA[2])
,ytop= prop(x=(m-1)/(palette_l),rangepropCB[1],rangepropCB[2])
,ybottom= prop(x=(m)/(palette_l),rangepropCB[1],rangepropCB[2])
,col=rgbcol
,border="transparent"
)
}
}
# done!
你可以尝试这个并查看结果图
rotate <- function(x) t(apply(x, 2, rev))
n <- 3
library(grid)
mm <- tcrossprod(seq(1,0,length.out = n))
tmp1 <- sapply(col2rgb("orange")/255, function(x) 1-mm*(1-x))
tmp2 <- sapply(col2rgb("cyan")/255, function(x) 1-rotate(mm)*(1-x))
tmp3 <- sapply(col2rgb("purple")/255, function(x) 1-rotate(rotate(mm))*(1-x))
tmp4 <- sapply(col2rgb("grey")/255, function(x) 1-rotate(rotate(rotate(mm)))*(1-x))

tmp <- (tmp1*tmp2*tmp3*tmp4)
grid.raster(matrix(rgb(tmp), nrow = n))


library(scales)

four.color.matrix <-
    function( mycols ){

        m <- matrix( NA , 100 , 100 )

        m[ 1 , 1 ] <- mycols[ 1 ]
        m[ 1 , 100 ] <- mycols[ 2 ]
        m[ 100 , 1 ] <- mycols[ 3 ]
        m[ 100 , 100 ] <- mycols[ 4 ]

        m[ 1 , 1:100 ] <- gradient_n_pal( c( mycols[ 1 ] , 'white' , mycols[ 2 ] ) , values = c( 1 , 50 , 100 ) )(1:100)
        m[ 1:100 , 1 ] <- gradient_n_pal( c( mycols[ 1 ] , 'white' , mycols[ 3 ] ) , values = c( 1 , 50 , 100 ) )(1:100)
        m[ 1:100 , 100 ] <- gradient_n_pal( c( mycols[ 2 ] , 'white' , mycols[ 4 ] ) , values = c( 1 , 50 , 100 ) )(1:100)
        m[ 100 , 1:100 ] <- gradient_n_pal( c( mycols[ 3 ] , 'white' , mycols[ 4 ] ) , values = c( 1 , 50 , 100 ) )(1:100)

        a <- gradient_n_pal( c( mycols[ 1 ] , 'white' , mycols[ 4 ] ) , values = c( 1 , 50 , 100 ) )
        diag(m)<-a(1:100)

        b <- gradient_n_pal( c( mycols[ 3 ] , 'white' , mycols[ 2 ] ) , values = c( 1 , 50 , 100 ) )
        for(i in 1:(nrow(m) - 1)){
          for (j in 1:nrow(m)) if (i + j == nrow( m )+1){
              m[i,j] <- b(j)
            }
        }

        for ( i in 2:50 ){

            m[ i , i:(101-i) ] <-
                gradient_n_pal( c( mycols[ 1 ] , 'white' , mycols[ 2 ] ) , values = c( 0 , 50 , 100 ) )(  i:(101-i) )

            m[ i:(101-i) , i ] <-
                gradient_n_pal( c( mycols[ 3 ] , 'white' , mycols[ 1 ] ) , values = c( 0 , 50 , 100 ) )( (101-i):i )

        }


        for ( i in 51:99 ){

            m[ i , i:(101-i) ] <-
                gradient_n_pal( c( mycols[ 3 ] , 'white' , mycols[ 4 ] ) , values = c( 0 , 50 , 100 ) )(  i:(101-i) )

            m[ i:(101-i) , i ] <-
                gradient_n_pal( c( mycols[ 4 ] , 'white' , mycols[ 2 ] ) , values = c( 0 , 50 , 100 ) )( (101-i):i )

        }

        m
    }


z <- four.color.matrix( c( 'red' , 'yellow' , 'green' , 'blue' ) )
library(grid)
grid.raster( z )

# original question asked for something like this
grid.raster( four.color.matrix( c( 'darkgreen' , 'darkgreen' , 'darkred' , 'darkgreen' ) ) )