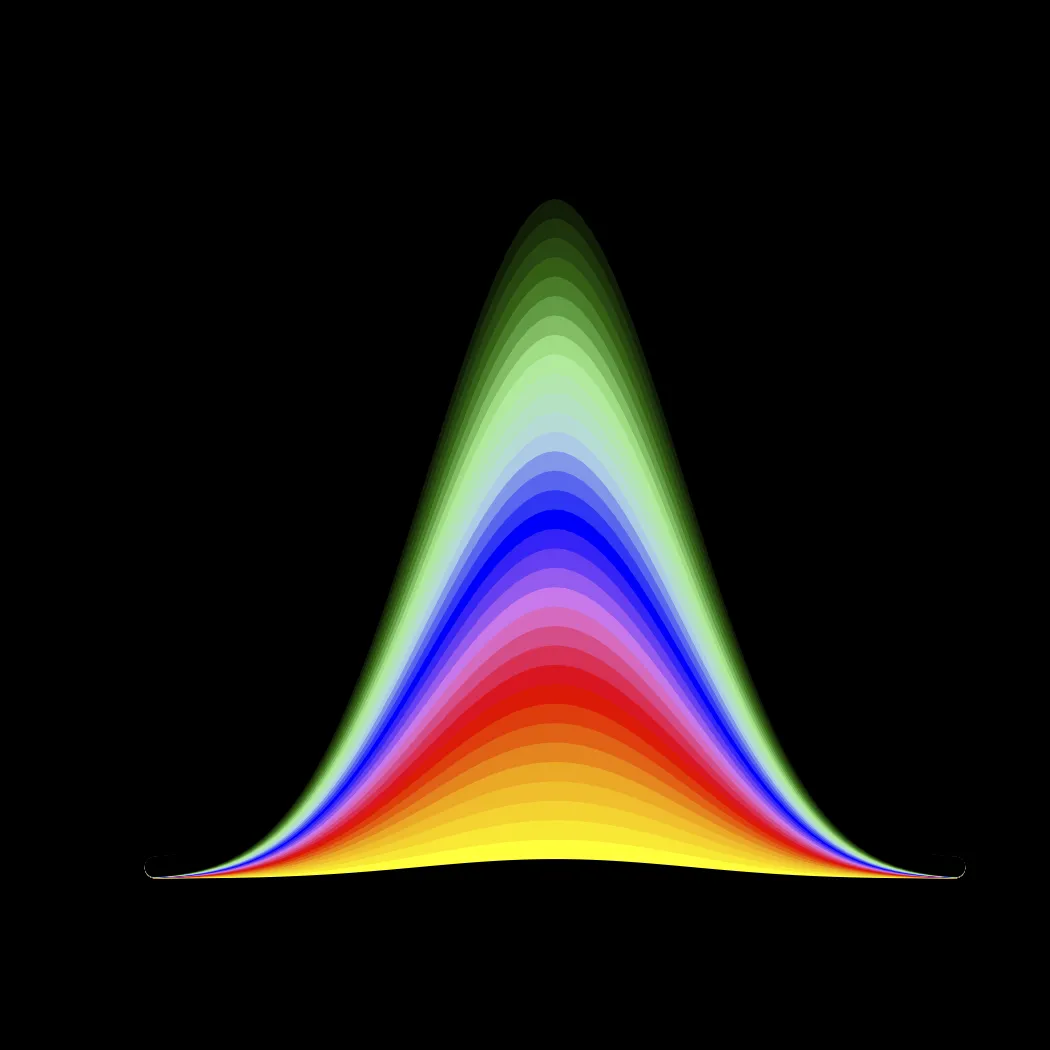
如何在R中使用渐变色制作曲线。看看这个火焰的图片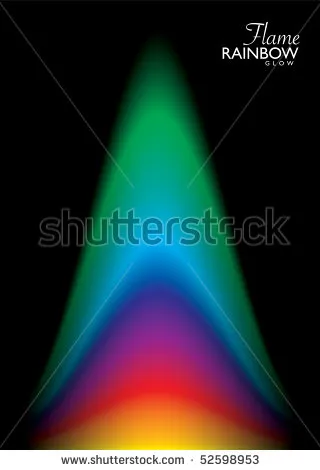 ,它应该是这个样子的。我试着画一个正常的曲线,然后再画一个正常的曲线,但从技术上讲,你不能用一堆正常的曲线来制作这样的图形,因为它们不会在正确位置的两侧相交。我该如何在R中制作这样的图形?有什么想法吗?
,它应该是这个样子的。我试着画一个正常的曲线,然后再画一个正常的曲线,但从技术上讲,你不能用一堆正常的曲线来制作这样的图形,因为它们不会在正确位置的两侧相交。我该如何在R中制作这样的图形?有什么想法吗?,它应该是这个样子的。我试着画一个正常的曲线,然后再画一个正常的曲线,但从技术上讲,你不能用一堆正常的曲线来制作这样的图形,因为它们不会在正确位置的两侧相交。我该如何在R中制作这样的图形?有什么想法吗?到目前为止,我能做到的最好的是:
 par(bg="black")
 plot(seq(0.15,0.85,by=0.01),
      5*dbeta(seq(0.15,0.85,by=0.01),10,10 ),
      type="l" , ylim=c(0,700) )  # this just sets up the plotting framework.

 for( i in 1:200 ) { lines(x= seq(0.15,0.85,by=0.01),
                           y= i*dbeta(seq(0.15,0.85,by=0.01),10,10 ),
                     col= colorRampPalette(c("yellow", "orange", "red", "hotpink",
                             "violet", "blue", "lightblue", "lightgreen", "darkgreen",
                             "black"))(200)[i],
                      lwd=13) }
 par(bg="white")
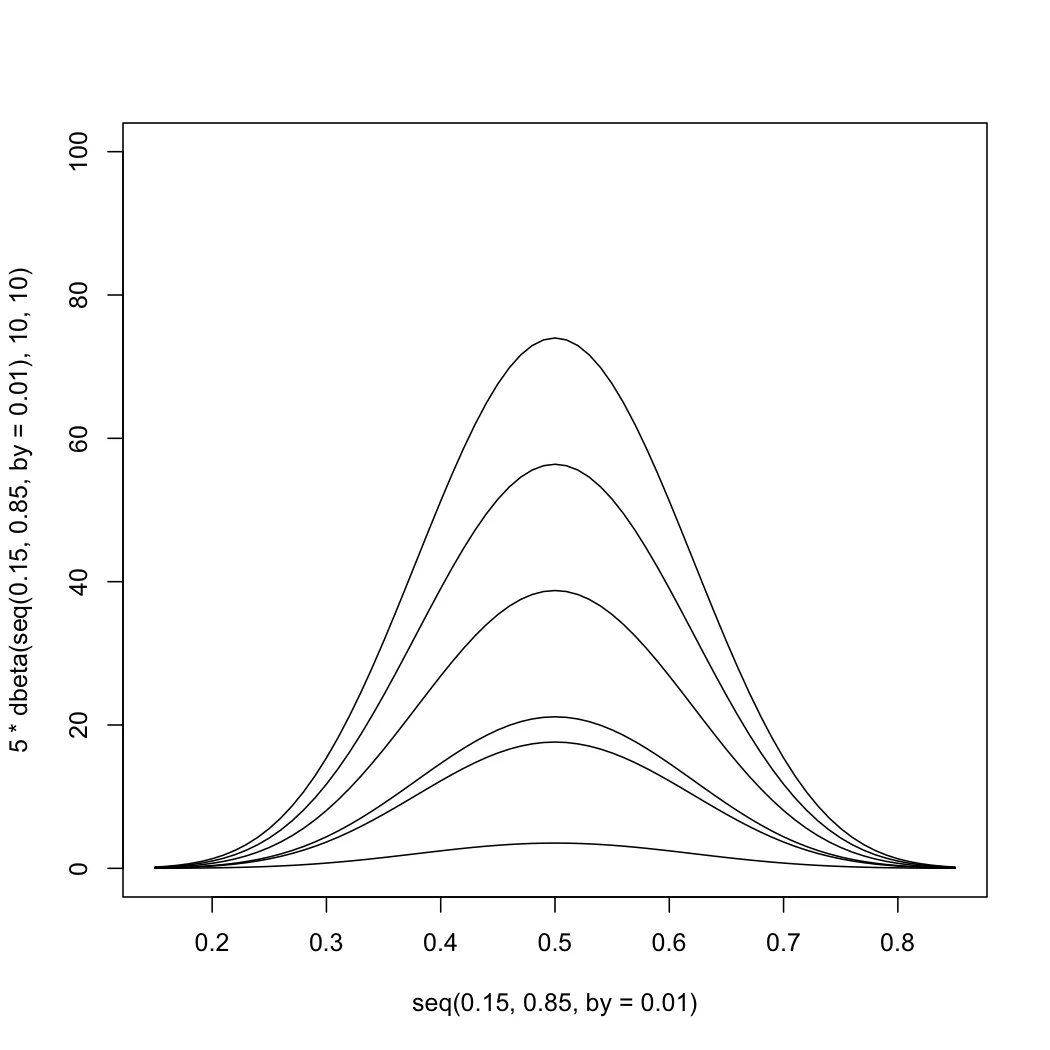
plot(seq(0.15,0.85,by=0.01), 5*dbeta(seq(0.15,0.85,by=0.01),10,10 ),
            type="l" , ylim=c(0,100))
for( i in seq(0.2, 5) ) { lines(seq(0.15,0.85,by=0.01),
                     i*5*dbeta(seq(0.15,0.85,by=0.01),10,10 ) ) }
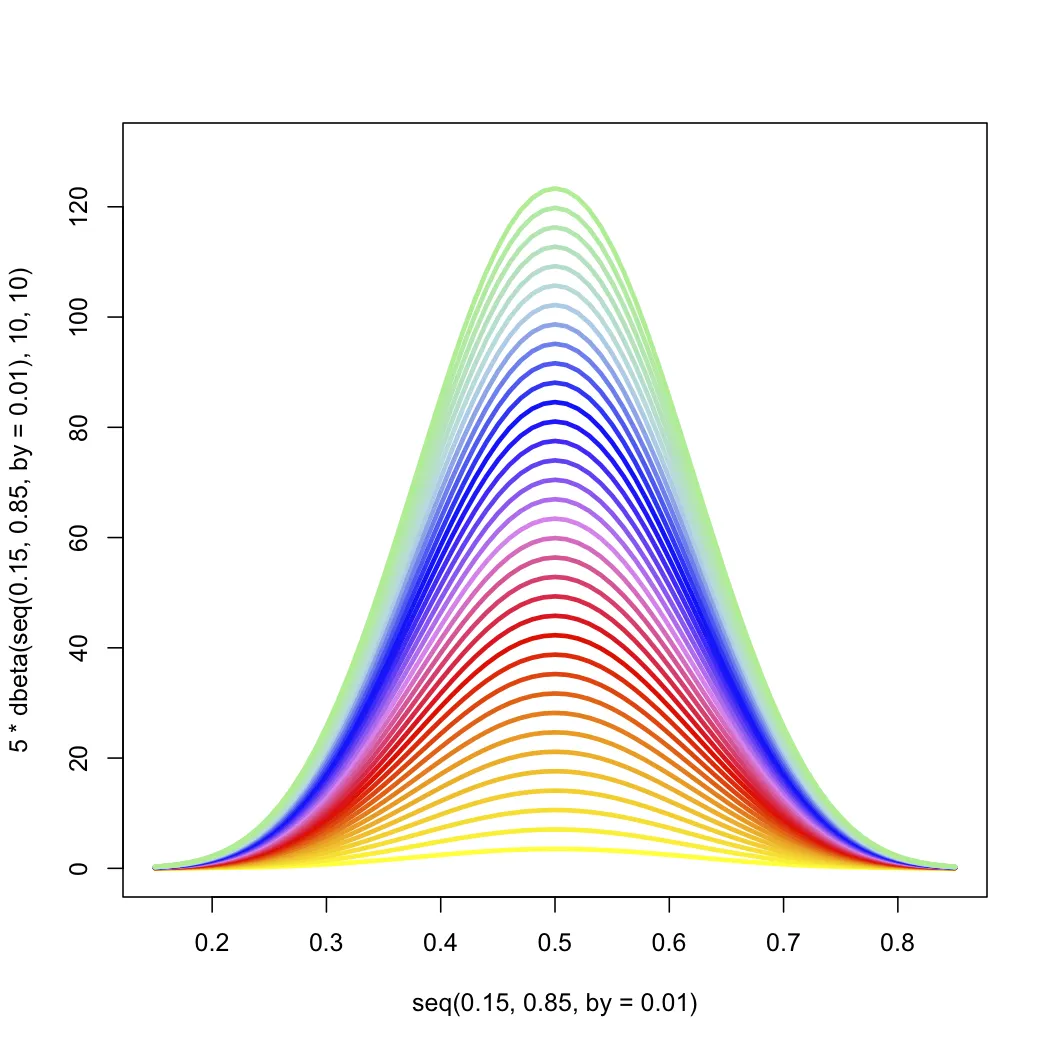
颜色相关:
plot(seq(0.15,0.85,by=0.01), 5*dbeta(seq(0.15,0.85,by=0.01),10,10 ), type="l" ,
          ylim=c(0,130))
for( i in 1:35 ) {lines(seq(0.15,0.85,by=0.01), i*dbeta(seq(0.15,0.85,by=0.01), 10,10 ),
                           col=colorRampPalette(c("yellow", "orange", "red", "violet",
                                        "blue", "lightblue", "lightgreen"))(35)[i],
                   lwd=3) }
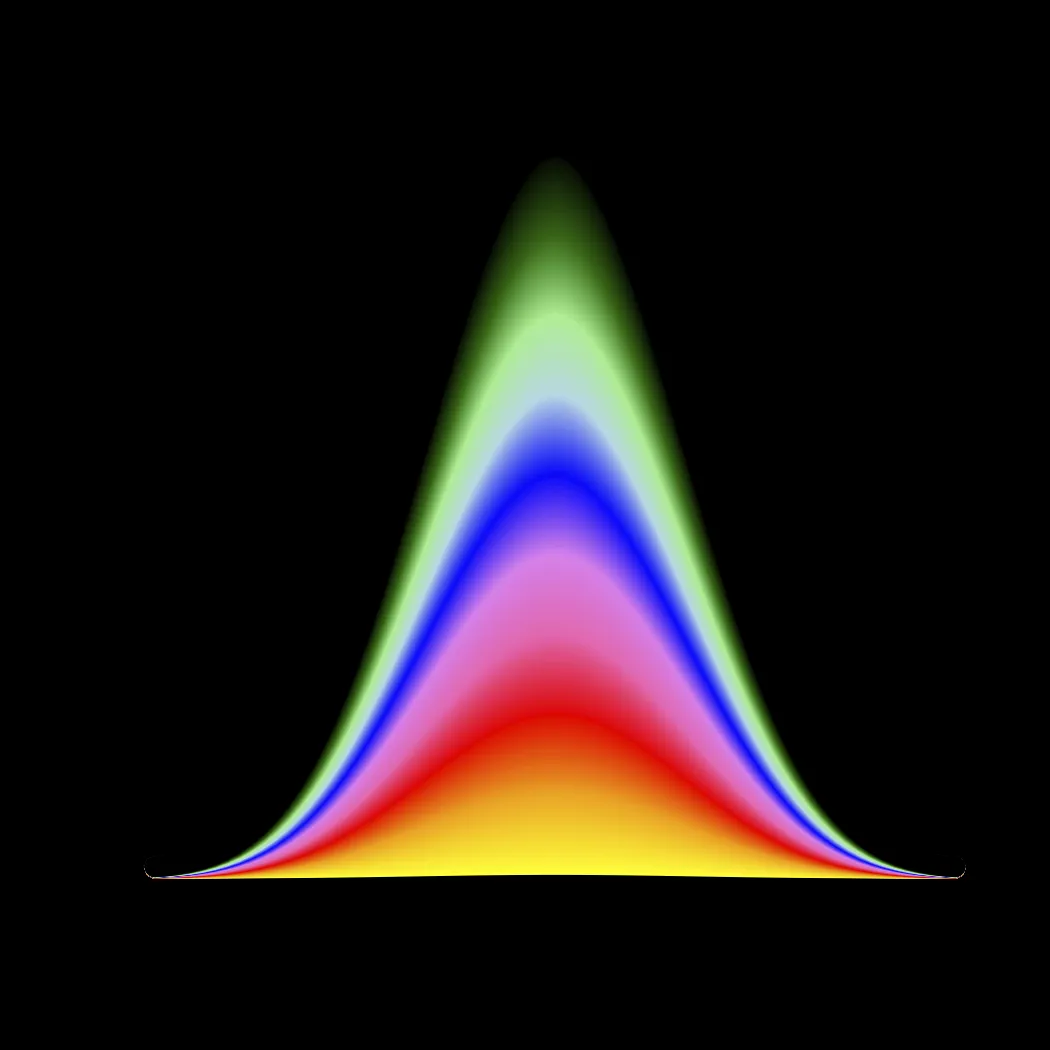
对于黑色背景和更浓密的颜色以及顶部的淡出效果:
 par(bg = 'black')
 plot(seq(0.15,0.85,by=0.01), 5*dbeta(seq(0.15,0.85,by=0.01),10,10 ), type="l",
          ylim=c(0,130) )
 for( i in 1:35 ) { lines(seq(0.15,0.85,by=0.01), i*dbeta(seq(0.15,0.85,by=0.01),10,10),
                          col=colorRampPalette(c("yellow", "orange", "red", "violet",
                                "blue", "lightblue", "lightgreen", "darkgreen",
                                 "black")) (35)[i],
                           lwd=13) }
grep("purple", colors(), value=TRUE)
 [1] "mediumpurple"  "mediumpurple1" "mediumpurple2" "mediumpurple3" "mediumpurple4"
 [6] "purple"        "purple1"       "purple2"       "purple3"       "purple4"