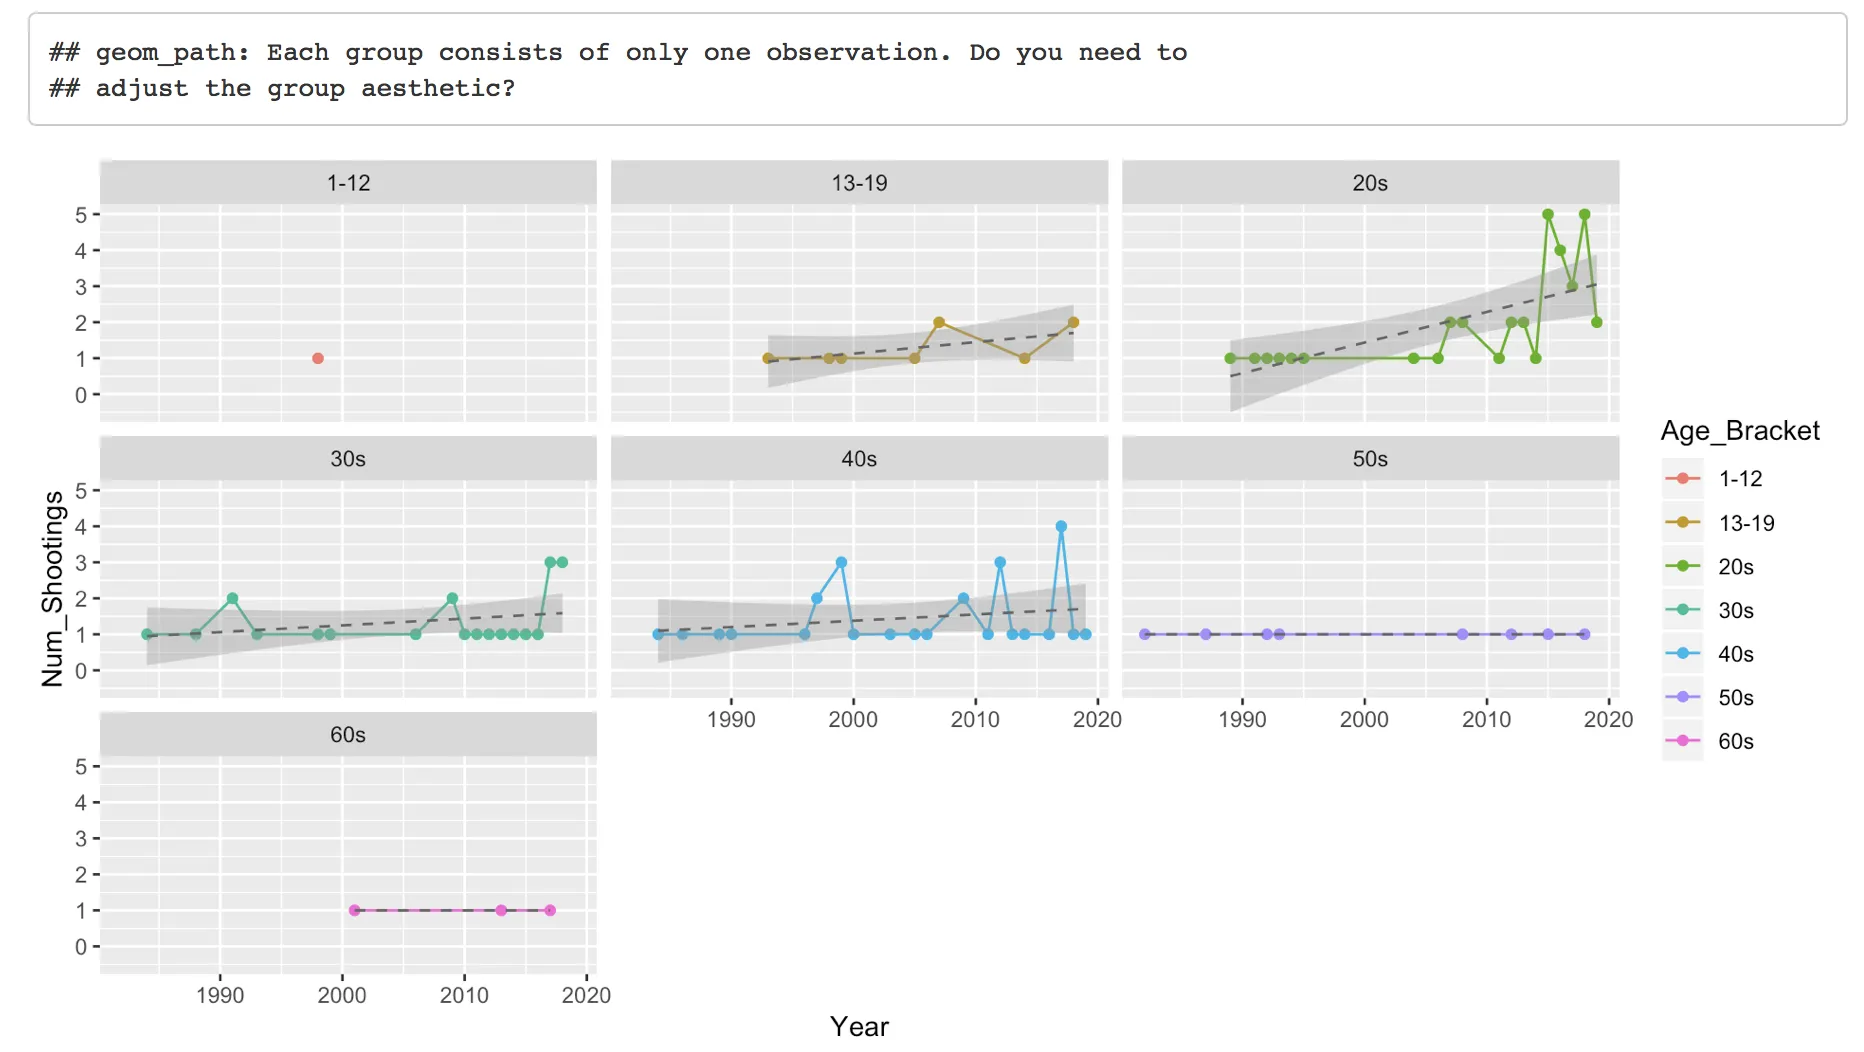
我正在尝试使用ggplot、geom_line和facet_wrap创建多条折线图。图表已成功创建并显示,但是还会显示以下消息:
geom_path: Each group consists of only one observation. Do you need to adjust the group aesthetic?
附加:
group=1
...不能消除警告信息。
我使用的RStudio版本是:版本1.1.463。
代码在一个RMarkdown文件中,我正在编织它以创建一个HTML文档。
我在这个Rmarkdown文件中使用的库是:
library(tidyverse)
library(operators)
library(magrittr)
library(dplyr)
library(knitr)
library(sf)
library(usmap)
library(waffle)
我正在图表中使用的数据集结构如下:
'data.frame':   75 obs. of  3 variables:
 $ Year         : int  1998 1993 1998 1999 2005 2007 2014 2018 1989 1991 ...
 $ Age_Bracket  : chr  "1-12" "13-19" "13-19" "13-19" ...
 $ Num_Shootings: num  1 1 1 1 1 2 1 2 1 1 ...
生成警告信息的代码如下:
# Create a faceted line graph showing the number of mass shootings per year for each age bracket

faceted_line_graph_year_age <- ggplot(data=shootings_per_year_age, aes(x=Year, y = Num_Shootings, colour = Age_Bracket, group=1)) +
  geom_line()+
  geom_point()+
  geom_smooth(method = "lm", colour = "#666666", linetype = 2, size = 0.5 )+
  facet_wrap(~Age_Bracket)


# Display the faceted line graph

faceted_line_graph_year_age
我看到的消息是:
geom_path: Each group consists of only one observation. Do you need to
## adjust the group aesthetic?
我希望图表能够在没有警告信息的情况下显示出来。 但实际上,我看到的是图表带有警告信息。
geom_line引起了错误,因为它无法在那里仅使用单个点绘制线条。这也是一个警告/消息(不确定具体是哪一个),而不是错误,否则您将无法生成图形。警告/消息主要是为了让您知道可能正在做错事情,但并不致命。 - Calum YouGeomPath$draw_panel中,我没有看到任何可以抑制该消息的内容。 - Z.LinsuppressWarnings(...)中运行您的代码。或者设置options(warn=...)为 -1 - 参见help(options)以了解其他值的含义。 - Spacedmangeom_line引起的。如果不影响绘图意图,可以删除此geom,这是最简单的方法。 - DaveRGPmessage_wrap之间某个地方它改变了类型。 - DaveRGP