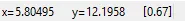
在下面的示例中,当我将鼠标悬停在图像上时,除了我希望显示在左下角的文本外,还会显示对应像素的灰度值。有没有方法可以抑制这些信息(或格式化它)?
import numpy as np
import matplotlib.pyplot as plt
class test():
def __init__(self):
fig=plt.figure()
ax=fig.add_subplot(111)
ax.imshow(np.random.rand(20,20))
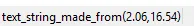
def format_coord(x,y):
return "text_string_made_from(x,y)"
ax.format_coord=format_coord
fig.canvas.draw()