使用Shiny、Leaflet和rCharts在R中创建带有标记的交互式Web地图

8
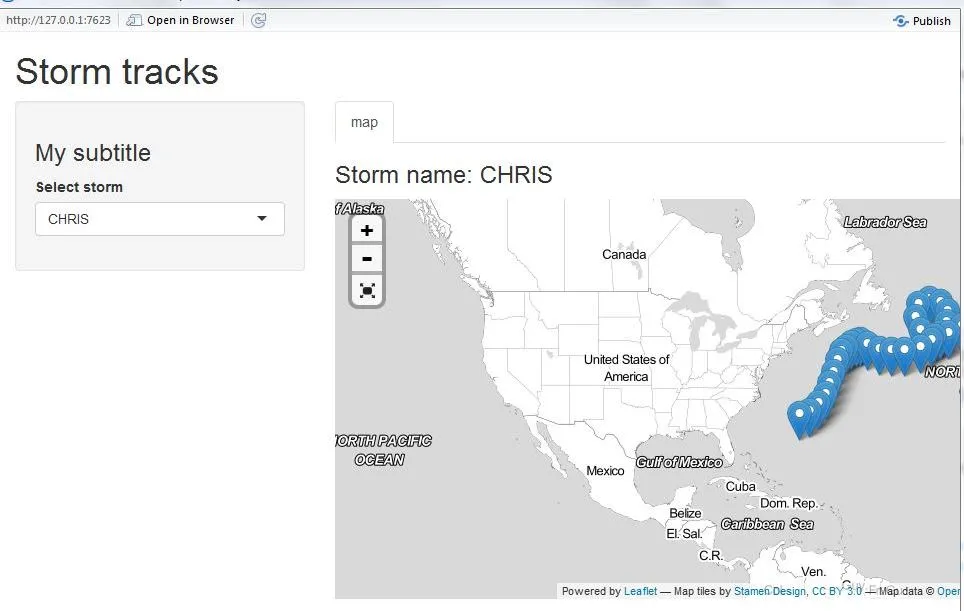
我正在尝试使用Shiny、Leaflet和rCharts在R中创建一个交互式Web地图来显示风暴(结构松散地基于http://ramnathv.github.io/bikeshare应用程序)。用户一次只能选择一个风暴名称(df$Name),该风暴的标记(lat/long)将显示在Leaflet地图上(具有缩放功能)。我无法使Leaflet为每个单独的风暴名称加载新地图和标记。任何帮助或建议都将不胜感激!这是数据(TCs.Rda)的样子(上传了样本数据文件here):
 Year   Name   Wind   lat    long
 2010   BONNIE 15     30.100 -91.000
 2010   FIVE   25     30.000 -88.900
 2010   FIVE   25     30.400 -88.800
 2010   FIVE   25     30.800 -88.600

server.R

library(shiny); library(rCharts); library(leaflet)    
load("TCs.Rda") 
name <- sort(unique(data$Name)) 
shinyServer(function(input, output){      
     dataset <- reactive({  df <- data[data$Name == input$name, ]  })    
     output$add <- renderText({paste("Storm name:", input$name)})  
     output$Controls <- renderUI({  
         list(selectInput("name", "Select storm", name, selected=name[1])) })  
     output$myChart <- renderMap({
         df <- dataset()
         map <- Leaflet$new()
         map$setView(c(35, -80),zoom=5) 
         map$tileLayer(provider='Stamen.TonerLite')          
         for (i in 1:nrow(df)) {
         map$marker(c(df[i, "lat"], df[i, "long"]), bindPopup=df[i, "Wind"])}  
         map$set(dom='myChart')
         map$enablePopover(TRUE)
         map$fullScreen(TRUE)
         map      
       })  
    })

ui.R

library(shiny); library(rCharts); library(leaflet)
shinyUI(pageWithSidebar( 
  headerPanel("Storm tracks"),  
  sidebarPanel(h3("My subtitle"), uiOutput("Controls")),  
  mainPanel(                     
     tabsetPanel(        
        h3(textOutput("add")),             
        tabPanel("map", tags$style(".leaflet {height: 400px;}"),  # I can only get this to work with a tabset panel, but ideally both the textOutput and map would go directly in the mainPanel 
        showOutput("myChart", "leaflet")))
      )
  ))
2个回答

6
我最终自己解决了这个问题!另一篇文章(Shiny渲染一个响应式rCharts leaflet地图一次,但如果更改输入变量则为空)指出代码行“map$set(dom='myChart')”可能会阻止Leaflet在每次选择时重新加载新地图。
我认为这可能不是这里的问题(我的示例有些不同,不使用geojson),但显然确实是这样。
以下是我的工作代码,希望能帮助其他人 -

server.R

library(shiny);library(rCharts);library(leaflet)
load("TCs.Rda")
name <- sort(unique(data$Name)) 
shinyServer(function(input, output){
   dataset <- reactive({df<- data[data$Name == input$name, ]})    
   output$add <- renderText({paste("Storm name:", input$name)})   
   output$Controls <- renderUI({list(selectInput("name", "Select storm", name, selected=name[1]) ) })   
output$myChart <- renderMap({
   df <- dataset()
   map <- Leaflet$new()
   map$setView(c(35, -80),zoom=3)
   map$tileLayer(provider='Stamen.TonerLite')       
   for (i in 1:nrow(df)) {map$marker(c(df[i, "lat"], df[i, "long"]))}        
   map$fullScreen(TRUE)
   map      
  })  
})

ui.R

library(shiny); library(rCharts); library(leaflet)
shinyUI(pageWithSidebar( 
   headerPanel("Storm tracks"),  
   sidebarPanel(h3("My subtitle"), uiOutput("Controls")),  
   mainPanel(      
      tabsetPanel(        
        tabPanel("map", h3(textOutput("add")),
             tags$style(".leaflet {height: 400px;}"), 
             showOutput("myChart", "leaflet")))
  )
  ))

结果看起来像这样:

在此输入图片描述

。这与IT技术有关。

2

网页内容由stack overflow 提供, 点击上面的
可以查看英文原文,
原文链接