我正在使用R创建一个leaflet地图 - 我不需要构建一个闪亮的应用程序,并且还没有掌握那个特定的技能集!
我试图跟随这篇文章的步骤在我的图例中创建圆形: Creating legend with circles leaflet R .
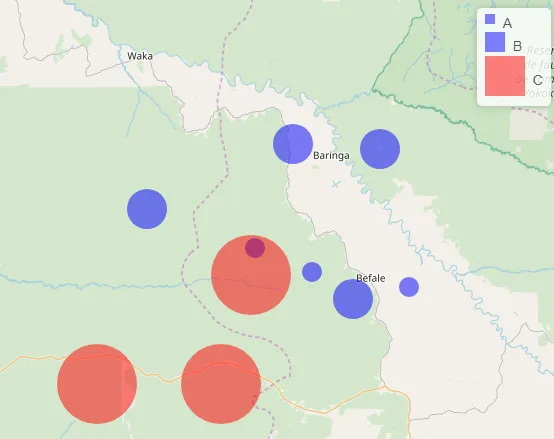
然而,我不确定如何将tags$style属性合并到我的R代码中,就像@K. Rhode建议的那样,以确保图例项目是圆形。 在我的代码中,图例出现了正方形。 快接近了!
有人可以帮助我将此代码推向使图例项成为圆形吗?
library(leaflet)
library(dplyr)

#create data
Points<-data.frame(x=runif(10,20,21), y=runif(10,0,1),
                   var=c(rep(c(10,20, 40),3), 20))
Points <- Points %>%
  mutate(Category = case_when(var == 10 ~ "A",
                              var == 20 ~ "B",
                              TRUE ~ "C"),
         color = case_when(Category == "A" ~ "blue",
                           Category == "B" ~ "blue",
                           TRUE ~ "red"))


map = leaflet() %>%
  addTiles()

addLegendCustom <- function(map, colors, labels, sizes, opacity = 0.5){
  colorAdditions <- paste0(colors, "; width:", sizes, "px; height:", sizes, "px")
  labelAdditions <- paste0("<div style='display: inline-block;height: ",
                           sizes, "px;margin-top: 4px;line-height: ", sizes, "px;'>",
                           labels, "</div>")

  return(addLegend(map, colors = colorAdditions,
                   labels = labelAdditions, opacity = opacity))
}


map %>%
  addCircleMarkers(Points$x,Points$y,radius=Points$var,
                   color = Points$color,
                   stroke = FALSE, fillOpacity = 0.5) %>%
  addLegendCustom(colors = c("blue", "blue", "red"),
                  labels = c("A", "B", "C"), sizes = c(10, 20, 40))
在图例中,我更喜欢使用圆形标记...而不是下面的正方形!