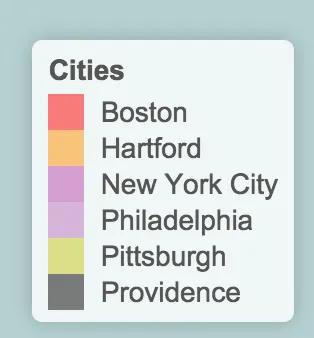
我正在使用R leaflet制作一个leaflet地图。我已经成功更改了我的图例边框。
.legend {
    padding: 6px 10px 6px 6px;
    color: #000033;
    background: #fff;
    border-left:5px solid #666666;
    border-right:5px solid #666666;
    border-top:5px solid #666666;
    border-bottom:5px solid #666666
}

.legend .circle {
  border-radius: 50%;
  width: 10px;
  height: 10px;
  margin-top: 8px;
}
我是CSS的新手,所以希望能得到一些建议。
这是我的HTML文档。
<!DOCTYPE html>
<html>
<head>
<meta charset="utf-8"/>
<script src="test_files/htmlwidgets-0.5/htmlwidgets.js"></script>
<script src="test_files/jquery-1.11.1/jquery.min.js"></script>
<link href="test_files/leaflet-0.7.3/leaflet.css" rel="stylesheet" />
<script src="test_files/leaflet-0.7.3/leaflet.js"></script>
<link href="test_files/leafletfix-1.0.0/leafletfix.css" rel="stylesheet" />
<link href="test_files/leaflet-label-0.2.2/leaflet.label.css" rel="stylesheet" />
<script src="test_files/leaflet-label-0.2.2/leaflet.label.js"></script>
<script src="test_files/leaflet-binding-1.0.1.9002/leaflet.js"></script>
</head>
<body style="background-color:white;">
<div id="htmlwidget_container">
<div id="htmlwidget-9645" style="width:100%;height:400px;" class="leaflet"></div>
</div>
<script type="application/json" data-for="htmlwidget-9645">{"x":{"calls":[{"method":"addTiles","args":["http://{s}.tile.openstreetmap.org/{z}/{x}/{y}.png",null,null,{"minZoom":0,"maxZoom":18,"maxNativeZoom":null,"tileSize":256,"subdomains":"abc","errorTileUrl":"","tms":false,"continuousWorld":false,"noWrap":false,"zoomOffset":0,"zoomReverse":false,"opacity":1,"zIndex":null,"unloadInvisibleTiles":null,"updateWhenIdle":null,"detectRetina":false,"reuseTiles":false,"attribution":"© <a href=\"http://openstreetmap.org\">OpenStreetMap</a> contributors, <a href=\"http://creativecommons.org/licenses/by-sa/2.0/\">CC-BY-SA</a>"}]},{"method":"addCircles","args":[[42.3601,41.7627,40.7127,39.95,40.4397,41.8236],[-71.0589,-72.6743,-74.0059,-75.1667,-79.9764,-71.4222],[24111.6030159755,10607.3229421942,86979.3078841169,37385.8261912185,16590.8679700611,12656.8005435813],null,null,{"lineCap":null,"lineJoin":null,"clickable":true,"pointerEvents":null,"className":"","stroke":true,"color":["#FF0000","#FF9000","#B649AF","#B873BC","#C7C617","#000000"],"weight":1,"opacity":0.5,"fill":true,"fillColor":["#FF0000","#FF9000","#B649AF","#B873BC","#C7C617","#000000"],"fillOpacity":0.2,"dashArray":null},["Boston","Hartford","New York City","Philadelphia","Pittsburgh","Providence"],null,null]},{"method":"addLegend","args":[{"colors":["#FF0000","#FF9000","#B649AF","#B873BC","#C7C617","#000000"],"labels":["Boston","Hartford","New York City","Philadelphia","Pittsburgh","Providence"],"na_color":null,"na_label":"NA","opacity":0.5,"position":"bottomright","type":"factor","title":"Cities","extra":null,"layerId":null,"className":"info legend"}]}],"limits":{"lat":[39.95,42.3601],"lng":[-79.9764,-71.0589]}},"evals":[]}</script>
<script type="application/htmlwidget-sizing" data-for="htmlwidget-9645">{"viewer":{"width":"100%","height":400,"padding":0,"fill":true},"browser":{"width":"100%","height":400,"padding":0,"fill":true}}</script>
</body>
</html>