在r和shiny中使用rCharts创建叶片热力图

5
我正在使用Ramnath Vaidyanathan在http://rmaps.github.io/blog/posts/leaflet-heat-maps/index.html上提供的优秀演示,并希望为我的闪亮应用程序复制他的热力图。
然而,当我尝试在闪亮中使用Ramnath的代码时,我只能得到地图,但无法得到热力图。我遇到问题的部分原因可能是Ramnath原始代码使用rMaps,而我正在使用rCharts(也是由Ramnath开发),因为它更为完善/与shiny更好地集成,当然包括Leaflet。我尝试使用rMaps和闪亮HTML通用命令renderUIhtmlOutput,但没有成功。
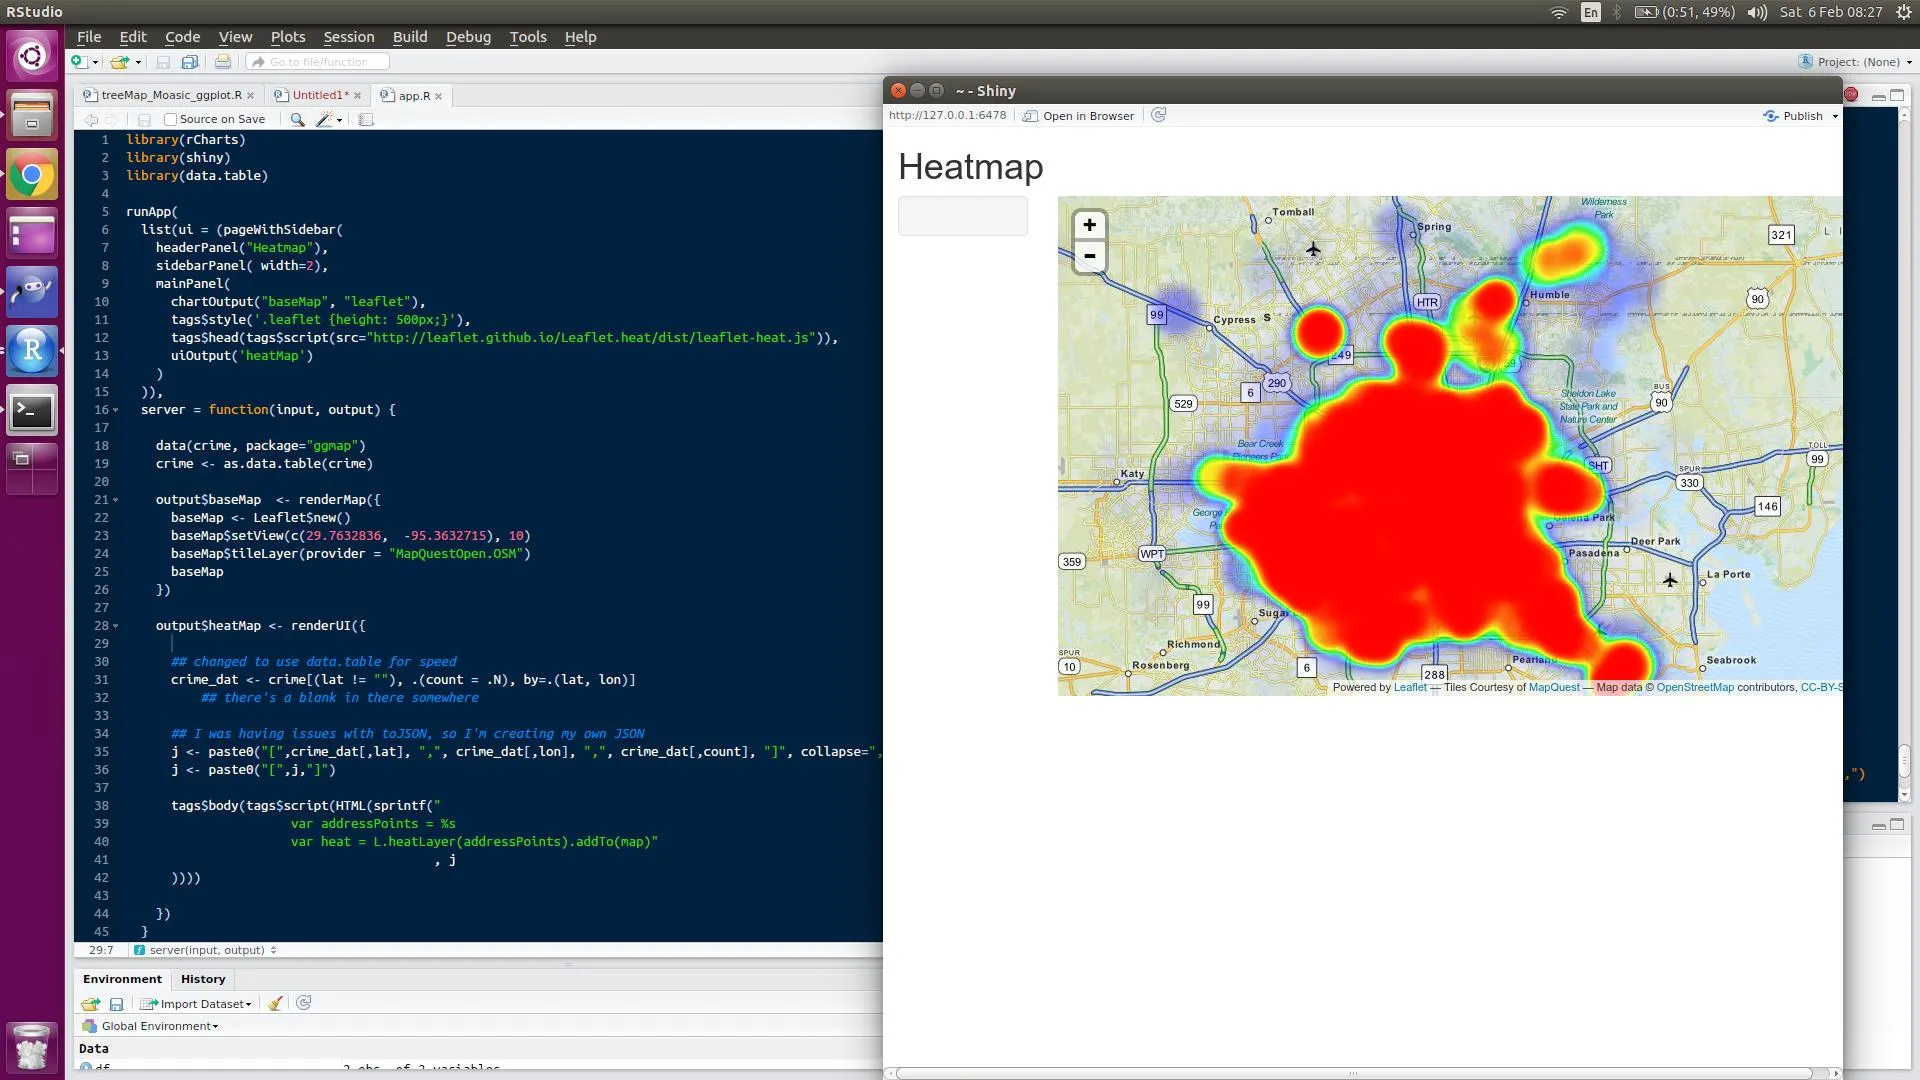
这是不起作用的闪亮代码(它只显示地图,而忽略了热点库):
library(rCharts)
library(shiny)

runApp(
list(ui = (pageWithSidebar(
headerPanel("Heatmap"),
sidebarPanel( width=2),
mainPanel(
mapOutput("leafmap")
)
)),
server = function(input, output) {
output$leafmap  <- renderMap({
L2 <- Leaflet$new()
L2$setView(c(29.7632836,  -95.3632715), 10)
L2$tileLayer(provider = "MapQuestOpen.OSM")
data(crime, package = 'ggmap')
library(plyr)
crime_dat = ddply(crime, .(lat, lon), summarise, count = length(address))
crime_dat = toJSONArray2(na.omit(crime_dat), json = F, names = F)
L2$addAssets(jshead = c(
 "http://leaflet.github.io/Leaflet.heat/dist/leaflet-heat.js"
 ))
L2$setTemplate(afterScript = sprintf("
                                 <script>
                                 var addressPoints = %s
                                 var heat = L.heatLayer(addressPoints).addTo(map)           
                                 </script>
                                 ", rjson::toJSON(crime_dat)
 ))

L2
})
}
))

在shiny中使用rCharts制作热力图已有解决方案。 - tospig
1个回答

4
将我的评论转化为答案(利用此问题/答案),请参见此处
library(rCharts)
library(shiny)
library(data.table)

runApp(
  list(ui = (pageWithSidebar(
    headerPanel("Heatmap"),
    sidebarPanel( width=2),
    mainPanel(
      chartOutput("baseMap", "leaflet"),
      tags$style('.leaflet {height: 500px;}'),
  tags$head(tags$script(src="http://leaflet.github.io/Leaflet.heat/dist/leaflet-heat.js")),
      uiOutput('heatMap')
    )
  )),
  server = function(input, output) {

    data(crime, package="ggmap")
    crime <- as.data.table(crime)

    output$baseMap  <- renderMap({
      baseMap <- Leaflet$new()
      baseMap$setView(c(29.7632836,  -95.3632715), 10)
      baseMap$tileLayer(provider = "MapQuestOpen.OSM")
      baseMap
    })

    output$heatMap <- renderUI({

      ## changed to use data.table for speed
      crime_dat <- crime[(lat != ""), .(count = .N), by=.(lat, lon)]
          ## there's a blank in there somewhere

      ## I was having issues with toJSON, so I'm creating my own JSON
      j <- paste0("[",crime_dat[,lat], ",", crime_dat[,lon], ",", crime_dat[,count], "]", collapse=",")
      j <- paste0("[",j,"]")

      tags$body(tags$script(HTML(sprintf("
                      var addressPoints = %s
                      var heat = L.heatLayer(addressPoints).addTo(map)"
                                         , j
      ))))

    })
  }
  ))

并且展示它的工作原理

在此输入图片描述


我可以在某个地方设置一个标尺,以便在何时变为蓝色、橙色或红色吗? - M. Kooi

网页内容由stack overflow 提供, 点击上面的
可以查看英文原文,
原文链接