在R中创建热力图图表?

4
这是我的rfm_table数据框:
 UserID    R F      M Rsegment Fsegment Msegment Total_Score
1  10609  984 3 318.78        2        4        4         244
2  10922  648 1 184.26        5        2        3         523
3  11300 1022 1  91.02        2        2        2         222
4  11400  864 5 851.73        3        5        5         355
5  11487  797 1 147.22        3        2        3         323
6  11762 1042 1  32.31        1        2        1         121

我想使用R语言中的Recency(最近)、Frequency(频率)和Monetary(货币)三列数据创建热力图,就像下面这张图片一样:enter image description here 
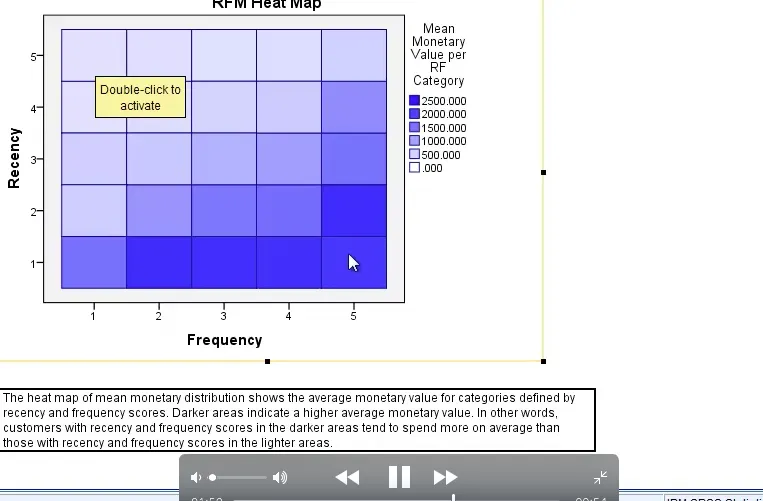
我使用了"plotly"包,并编写以下代码,但出现了以下错误:
# minimal value for n is 3, returning requested palette with 3 different levels
plot_ly(z = rfm_table[,c(5,6,4)]
        x = c("1","2","3","4","5"), y =c("1","2","3","4","5"),
       type = "heatmap")

有人能解释一下我该做什么吗?

2个回答

3

我从未使用过plotly软件包或其任何功能。以下是替代解决方案,包括对我最好的一个(来自lattice软件包)。

原始数据(顺便说一下,如果您提供了像这样的测试数据而不仅仅是上面的打印输出,那将非常有帮助...)

d1 <- data.frame(UserID = factor(rep(paste("id", 1:10), 50, sep = "")),
                 RR = factor(rep(1:5, 100)),
                 FF = factor(rep(1:5, each = 100)),
                 MM = round(1000*rnorm(500), 2))
table(d1$R, d1$F)

# Means of groups, long format
d.l <- aggregate(x = d1$M,
                 by = list(RR = d1$RR,
                           FF = d1$FF),
                 FUN = mean)

# Same data, wide format
d.w <- reshape(data = d.l,
               idvar = "RR",
               timevar = "FF",
               direction = "wide")
mm <- as.matrix(d.w[, -1])
colnames(mm) <- 1:5

使用颜色键绘制热力图 选项1:使用默认的heatmap函数

heatmap(mm,
        Rowv = NA,
        Colv = NA,
        xlab = "FF",
        ylab = "RR",
        main = "XXX")

这里输入图片描述

您可以使用 legend 添加键,但需要一些工作。

选项 2(我最喜欢的):使用 lattice 包。

require(lattice)
levelplot(mm,
          xlab = "FF",
          ylab = "RR",
          main = "XXX",
          col.regions = heat.colors)

Option 3: 使用包gplots

在这里输入图片描述

require(gplots)
heatmap.2(mm,
          Rowv = F,
          Colv = F,
          density.info = "none",
          trace = "none",
          xlab = "FF",
          ylab = "RR",
          main = "XXX")

这里输入图片描述

选项4:使用ggplots 我不会写那段代码,但你可以在这里看到。


2

plot_ly调用中,你的z应该是一个矩阵,每个行列对应于xy的值。

require(plotly)
rfm_table <- read.table(text="
  UserID    R F      M Rsegment Fsegment Msegment Total_Score
  10609  984 3 318.78        2        4        4         244
  10922  648 1 184.26        5        2        3         523
  11300 1022 1  91.02        2        2        2         222
  11400  864 5 851.73        3        5        5         355
  11487  797 1 147.22        3        2        3         323
  11762 1042 1  32.31        1        2        1         121",
  header = TRUE)
df <- expand.grid(lapply(rfm_table[, 5:6], function(x) sort(unique(x))))
df <- merge(df, rfm_table[, 4:6], by = c("Rsegment", "Fsegment"), all.x = TRUE)
df <- df[order(df$Rsegment, df$Fsegment), ]
z <- matrix(df$M, nrow = length(unique(df$Rsegment)))
plot_ly(z = z, x = sort(unique(df[[1]])), y = sort(unique(df[[2]])),
        type = "heatmap")

网页内容由stack overflow 提供, 点击上面的
可以查看英文原文,
原文链接