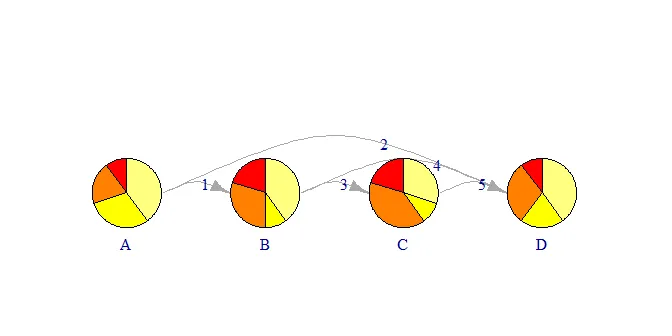
我想编写一个能够绘制有定向的图形并使每个顶点对齐并在下面添加一些文本的函数,例如下面的示例绘图。绘图功能应该能够处理将饼状图作为顶点,所以我使用了R语言中的igraph包。
adjm <- matrix(c(0,1,0,1,
                 0,0,1,1,
                 0,0,0,1,
                 0,0,0,0), nrow=4, byrow=TRUE)

g1 <- graph.adjacency(adjm, mode="directed")

values <- lapply(1:4, function(x) sample(1:4,4))

windows(width=7, height=3.5)

plot(g1, layout=layout.grid(g1, width=4),
     vertex.shape="pie", vertex.pie=values,
     vertex.pie.color=list(heat.colors(4)),
     edge.curved=TRUE,
     vertex.label=LETTERS[1:4], vertex.size=50,
     vertex.label.dist=5, vertex.label.degree=pi/2,
     edge.label=1:5, rescale=FALSE,
     xlim=c(-0.2,3.5), ylim=c(0,0.5))
I have two problems.
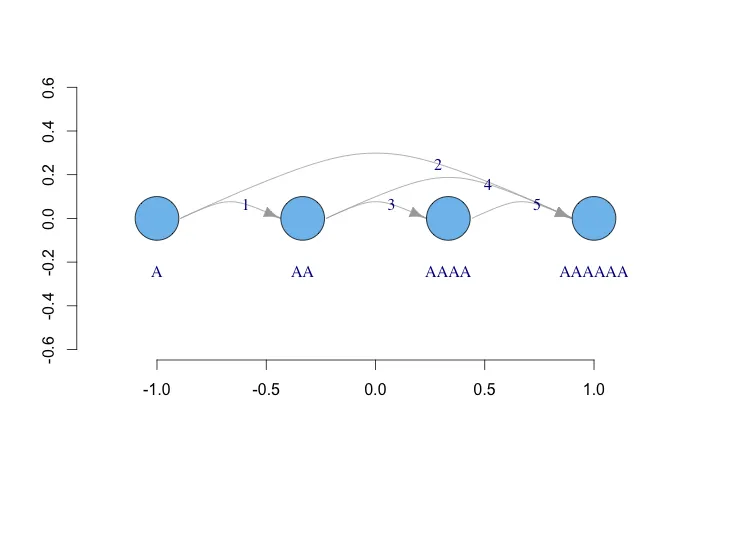
Why is it that the longer the vertex label, the longer the distance to the vertex centre as in the following example? Can I force them to appear at the same level without manually finding and defining them the right distance?
windows(width=7, height=3.5)

plot(g1, layout=layout.grid(g1, width=4),
     vertex.shape="pie", vertex.pie=values,
     vertex.pie.color=list(heat.colors(4)),
     edge.curved=TRUE,
     vertex.label=c("A", "AA", "AAAA", "AAAAAA"), vertex.size=50,
     vertex.label.dist=5, vertex.label.degree=pi/2,
     edge.label=1:5, rescale=FALSE,
     xlim=c(-0.2,3.5), ylim=c(0,0.5))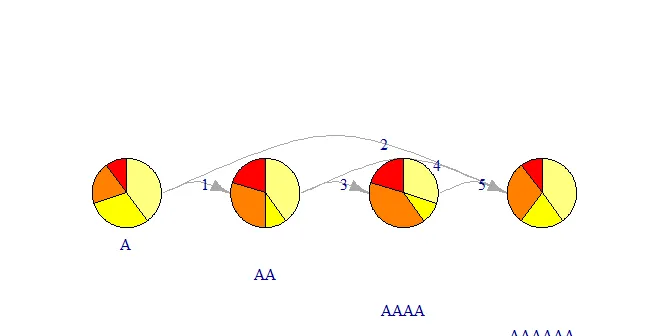
How to remove empty space when plotting aligned plots? If I make a horizontal graph it will be placed at the bottom of the window with a lot of empty space. The flatter the image, the smaller the graph, as in the third plot. (It seems that the size of the graph is determined such that the plot would fit in any position, vertical or horizontal.)
plot(g1, layout=layout.grid(g1, width=4), vertex.shape="pie", vertex.pie=values, vertex.pie.color=list(heat.colors(4)), edge.curved=TRUE, vertex.label=c("A", "AA", "AAAA", "AAAAAA"), vertex.size=20, vertex.label.dist=2, vertex.label.degree=pi/2, edge.label=1:5)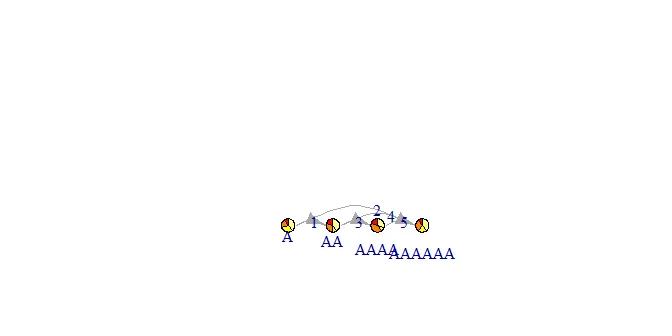 I can write argument
 asp=0to keep the vertices the right size in a flatter window but the automatic curvatures and the positions of the vertex labels change. I can manually tweak negative upper margin, label distances, and edge curvature, but of course this is not a solution for a generic function. The best result so far was the result ofrescale=FALSEas in the code for the first plot, but the edge curvatures are still too small and with larger vertices they get behind the vertices completely. (Also, the problem with varying vertex label distances still remains.) Direct use ofautocurve.edgesis not giving me any curvature. Any ideas of what to try next?