使用Seaborn的catplot函数绘制堆积条形图

4
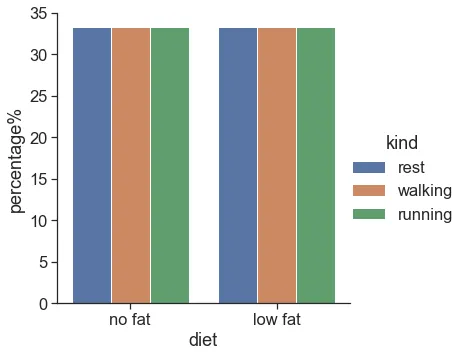
我想知道是否可以使用Seaborn的catplot绘制堆叠条形图。 例如:
import seaborn as sns
exercise = sns.load_dataset("exercise")
plot = exercise.groupby(['diet'])['kind'].value_counts(normalize=True).mul(100).reset_index(name='percentage%')
g = sns.catplot(x="diet", y="percentage%", hue="kind", data=plot, kind='bar')

我想要堆叠kind,但似乎catplot不支持'stacked'参数。

在此输入图片描述

1个回答

3

使用sns.barplot无法实现,我认为最接近的方法是使用sns.histplot

import seaborn as sns
exercise = sns.load_dataset("exercise")
plot = exercise.groupby(['diet'])['kind'].value_counts(normalize=True).mul(100).reset_index(name='percentage')
g = sns.histplot(x = 'diet' , hue = 'kind',weights= 'percentage',
             multiple = 'stack',data=plot,shrink = 0.7)

enter image description here


为什么要计算值的数量并将其作为权重传递给histplot,而不是让histplot自己计算它们? - mwaskom
嗨@mwaskom,是的,就像
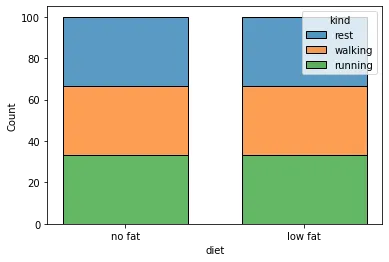
sns.histplot(x='diet',hue='kind',multiple='stack',data=exercise,shrink=0.7)这样的东西,但不确定如何使用sns.histplot函数将其归一化为百分比... - StupidWolf

网页内容由stack overflow 提供, 点击上面的
可以查看英文原文,
原文链接