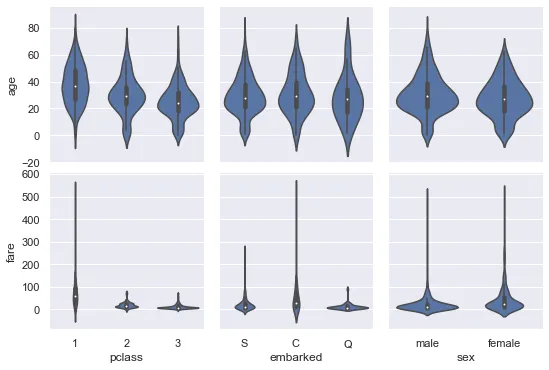
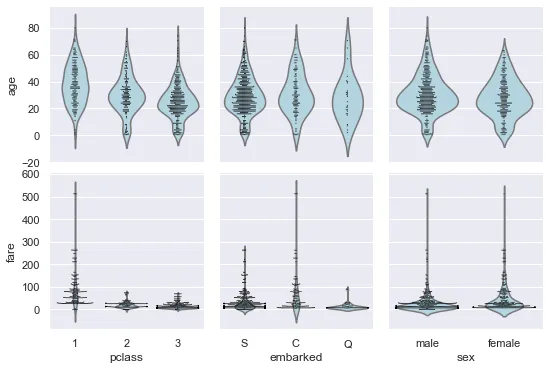
我正在处理泰坦尼克号数据集,并试图生成一个数值变量与分类变量之间的成对图。我可以使用Seaborn的catplot绘制一个数值变量与一个分类变量的图:
import seaborn as sns

sns.catplot(data=train, x='Fare', y='Sex')
然而,如果我尝试使用PairGrid将数值变量与分类变量绘制图表:
x_vars = ['Fare']
y_vars = ['Sex']

g = sns.PairGrid(train, x_vars=x_vars, y_vars=y_vars)
g.map(sns.catplot)
这会出现一个错误:
---------------------------------------------------------------------------
TypeError                                 Traceback (most recent call last)
<ipython-input-75-c284a7cfd727> in <module>
      9 #g.map_diag(lambda x, **kwargs: sns.catplot(x, x, **kwargs), jitter=True, kind="bar")
     10 #g.map(sns.scatterplot, y_jitter=1)#, hue=train["Survived"])
---> 11 g.map(sns.catplot)#, hue=train["Survived"])

~/MLProject/book1/lib/python3.8/site-packages/seaborn/axisgrid.py in map(self, func, **kwargs)
   1363         row_indices, col_indices = np.indices(self.axes.shape)
   1364         indices = zip(row_indices.flat, col_indices.flat)
-> 1365         self._map_bivariate(func, indices, **kwargs)
   1366         return self
   1367

~/MLProject/book1/lib/python3.8/site-packages/seaborn/axisgrid.py in _map_bivariate(self, func, indices, **kwargs)
   1504             y_var = self.y_vars[i]
   1505             ax = self.axes[i, j]
-> 1506             self._plot_bivariate(x_var, y_var, ax, func, kw_color, **kws)
   1507         self._add_axis_labels()
   1508

~/MLProject/book1/lib/python3.8/site-packages/seaborn/axisgrid.py in _plot_bivariate(self, x_var, y_var, ax, func, kw_color, **kwargs)
   1534             color = self.palette[k] if kw_color is None else kw_color
   1535
-> 1536             func(x, y, label=label_k, color=color, **kwargs)
   1537
   1538         self._clean_axis(ax)

~/MLProject/book1/lib/python3.8/site-packages/seaborn/categorical.py in catplot(x, y, hue, data, row, col, col_wrap, estimator, ci, n_boot, units, seed, order, hue_order, row_order, col_order, kind, height, aspect, orient, color, palette, legend, legend_out, sharex, sharey, margin_titles, facet_kws, **kwargs)
   3760
   3761     # Initialize the facets
-> 3762     g = FacetGrid(**facet_kws)
   3763
   3764     # Draw the plot onto the facets

~/MLProject/book1/lib/python3.8/site-packages/seaborn/axisgrid.py in __init__(self, data, row, col, hue, col_wrap, sharex, sharey, height, aspect, palette, row_order, col_order, hue_order, hue_kws, dropna, legend_out, despine, margin_titles, xlim, ylim, subplot_kws, gridspec_kws, size)
    268         # Make a boolean mask that is True anywhere there is an NA
    269         # value in one of the faceting variables, but only if dropna is True
--> 270         none_na = np.zeros(len(data), np.bool)
    271         if dropna:
    272             row_na = none_na if row is None else data[row].isnull()

TypeError: object of type 'NoneType' has no len()
如果我将 g.map(sns.catplot) 替换为 g.map(sns.scatterplot),它会成功地绘制图表而没有错误。
如何将 catplot 与 PairGrid 结合使用?


seaborn.catplot会创建自己的图形并将FacetGrid插入其中。因此,您在这里尝试创建一个 PairGrid,并为每个网格成员创建一个新图和一个新网格。但这样做行不通。所以答案很简单:您无法将catplot与PairGrid结合使用。(您可以尝试使用stripplot?如果仍然不行,请提供 [mcve] 以便进行测试。) - ImportanceOfBeingErnest