我正在使用 D3 v6 创建一个类似于 GitHub 热图的日历热图。这是我的起点https://observablehq.com/@d3/calendar-view,但是我只想要一个与 GitHub 热图完全相同的一年地图,从今天往前推一年。
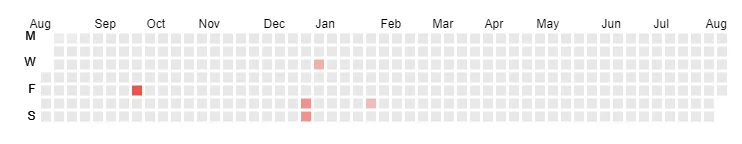
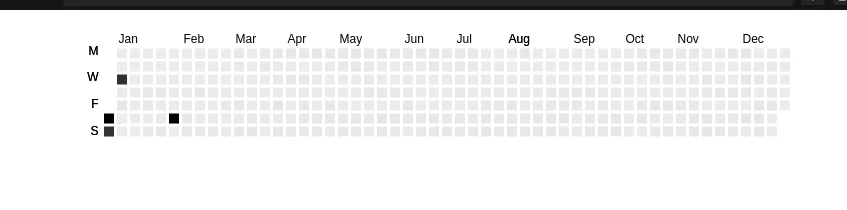
到目前为止,这是我能够实现的https://codesandbox.io/s/heatmap-d3-tzpnu?file=/src/App.js。
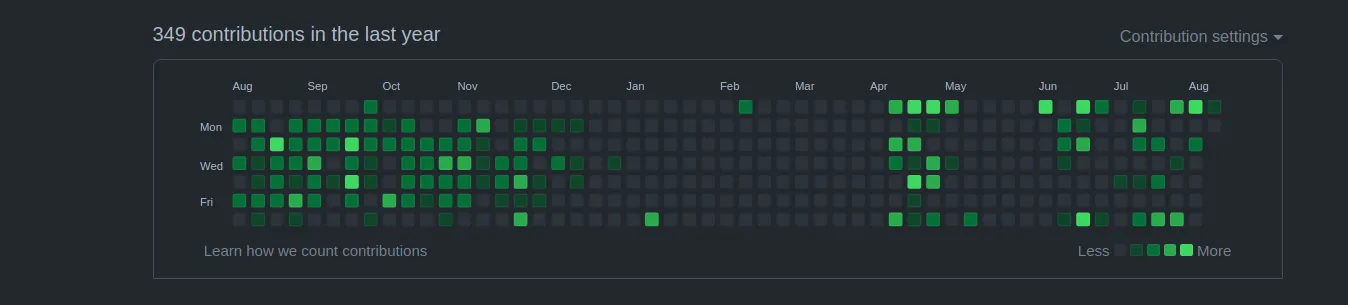
我该如何使其从2020年8月开始并一直显示到今天(2021年8月)? 就像 GitHub 一样:
以下是React中的热力图代码:
到目前为止,这是我能够实现的https://codesandbox.io/s/heatmap-d3-tzpnu?file=/src/App.js。
我该如何使其从2020年8月开始并一直显示到今天(2021年8月)? 就像 GitHub 一样:
以下是React中的热力图代码:
import React, { useEffect, useRef, useState } from "react";
import * as d3 from "d3";
import dayjs from "dayjs";
import utc from "dayjs/plugin/utc";
// import { legend } from '@d3/color-legend';

const Heatmap = ({ data }) => {
  const [fullYearData, setFullYearData] = useState([]);
  const [originalData, setOriginalData] = useState([]);

  dayjs.extend(utc);

  let chartRef = useRef(null);
  const now = dayjs();
  const today = now.format("YYYY/MM/DD");

  useEffect(() => {
    setOriginalData(data);
  }, [data]);

  useEffect(() => {
    const yearBackFromNow = now.subtract(1, "year").format("YYYY/MM/DD");
    const firstDate = yearBackFromNow;
    const lastDate = today;

    // fill the missing dates
    if (data && originalData.length > 0) {
      const dates = [
        ...Array(
          Date.parse(lastDate) / 86400000 - Date.parse(firstDate) / 86400000 + 1
        ).keys()
      ].map(
        (k) =>
          new Date(86400000 * k + Date.parse(firstDate))
            .toISOString()
            .slice(0, 10)
        // .replace(/-0(\d)$/, '-$1')
      );

      // console.log(dates);

      let response = [];
      for (let i = 0, j = 0; i < dates.length; i++) {
        response[i] = {
          date: dates[i],
          contributions:
            dates[i] === originalData[j]?.date
              ? originalData[j++].contributions
              : 0
        };
      }

      setFullYearData(response);
    }
  }, [originalData]);

  useEffect(() => {
    if (chartRef && fullYearData) {
      let chart = chartRef?.current;

      // remove existing svg before showing chart:
      //Prevent showing multiple charts

      d3.select(".heatmap").remove();

      const years = d3.groups(fullYearData, (d) =>
        new Date(d.date).getUTCFullYear()
      );

      // const years = data;

      var margin = { top: 80, right: 25, bottom: 30, left: 40 };
      // width = 650 - margin.left - margin.right,
      // height = 400 - margin.top - margin.bottom;
      const weekday = "sunday";
      const cellSize = 13;
      let width = 730;
      const height = cellSize * 9;
      // const height = cellSize * (weekday === 'weekday' ? 7 : 9);

      // append the svg object to the body of the page
      var svg = d3
        .select(chart)
        .append("svg")
        .attr("class", "heatmap")
        .style("width", width);

      // create a tooltip
      var tooltip = d3
        .select(chart)
        .append("div")
        .style("opacity", 0)
        .attr("class", "tooltip")
        .style("background-color", "#1f1f1f")
        .style("padding", "12px 20px")
        .style("color", "#ffffff")
        .style("width", "250px")
        .style("z-index", "10")
        .style("line-height", "19px")
        .style("position", "absolute");

      // Three function that change the tooltip when user hover / move / leave a cell

      const mouseover = function (event, d) {
        tooltip.style("opacity", 1);
        d3.select(this).style("stroke", "black").style("opacity", 1);
      };

      var mousemove = function (event, d) {
        const formatDate = d3.utcFormat("%d/%m/%Y");
        const date = formatDate(new Date(d.date));

        tooltip
          .style(
            "left",
            `${event.pageX > 1600 ? event.pageX - 200 : event.pageX}px`
          )
          .style("top", `${event.pageY + 20}px`)
          .html("Date: " + date)
          .append("div")

          .html(`Value: ${d.contributions}`);
        // .style('position', 'absolute');
        // .html('The exact value of<br>this cell is: ' + d.value)
      };
      var mouseleave = function (event, d) {
        tooltip.style("opacity", 0);
        d3.select(this).style("stroke", "none").style("opacity", 0.8);
      };

      const timeWeek = weekday === "sunday" ? d3.utcSunday : d3.utcMonday;
      const countDay = weekday === "sunday" ? (i) => i : (i) => (i + 6) % 7;

      // const formatValue = d3.format('+.2%');
      // const formatClose = d3.format('$,.2f');
      // const formatDate = d3.utcFormat('%x');
      // const formatDay = i => 'SMTWTFS'[i];
      const formatDay = (i) => "MWFS"[i];
      const formatMonth = d3.utcFormat("%b");
      // const max = d3.quantile(data, 0.9975, d => Math.abs(d.value));
      // const color = d3.scaleSequential(d3.interpolatePiYG).domain(['white', 'red']);

      const color = d3
        .scaleLinear()
        .domain([0, d3.max(fullYearData, (d) => Math.abs(d.value))])
        .range(["#EFCFCE", "#F0524D"]);

      const year = svg
        .selectAll("g")
        .data(years)
        .join("g")
        // .attr('transform', (d, i) => `translate(40.5,${height * i + cellSize * 1.5})`);
        .attr("transform", (d, i) => {
          return `translate(40.5,${"30"})`;
        });

      year
        .append("g")
        .attr("text-anchor", "end")
        .selectAll("text")
        .data(d3.range(7))
        // .data(weekday === 'weekday' ? d3.range(1, 6) : d3.range(4))
        .join("text")
        .attr("x", -5)
        .attr("y", (i) => (countDay(i) + 0.5) * cellSize)
        .attr("dy", (d, i) => `${1.15 * i}em`)
        .attr("class", "week")
        .style("font-size", "12px")
        // .text('')
        .text(formatDay);

      const now = dayjs();
      const today = now.format("YYYY/MM/DD");
      const yearBackFromNow = now.subtract(1, "year").format("YYYY/MM/DD");

      console.log(
        "utcsun",
        d3.utcSunday(),
        d3.utcSunday.count(new Date(yearBackFromNow), new Date(today))
      );

      year
        .append("g")
        .style("position", "relative")
        .selectAll("rect")
        .data(([, values]) => {
          // filter to show only selected months data
          // return values.filter(d => showMonths.includes(new Date(d.date).getUTCMonth()));
          // return new Date(values.date).getUTCMonth();
          console.log(values.reverse());
          return values.reverse();
        })
        // .data(
        //   weekday === 'weekday'
        //     ? ([, values]) => values.filter(d => ![0, 6].includes(new Date(d.date).getUTCDay()))
        //     : ([, values]) => values
        // )
        .join("rect")
        .attr("width", cellSize - 3)
        .attr("height", cellSize - 3)
        // .attr('x', d => {
        //   console.log('d===', d);
        //   return timeWeek.count(d3.utcYear(yearBackFromNow, new Date(d.date))) * cellSize + 0.5;
        // })
        // .attr('x', d => timeWeek.count(new Date(yearBackFromNow), new Date(today)) * cellSize + 0.5)
        .attr(
          "x",
          (d) =>
            timeWeek.count(d3.utcYear(new Date(d.date)), new Date(d.date)) *
              cellSize +
            0.5
        )
        .attr(
          "y",
          (d) => countDay(new Date(d.date).getUTCDay()) * cellSize + 0.5
        )
        .attr("fill", (d) => {
          if (d.contributions) {
            return color(d.contributions);
          } else {
            return "#E7E7E7";
          }
        })
        .on("mouseover", mouseover)
        .on("mousemove", mousemove)
        .on("mouseleave", mouseleave)
        .append("title");

      // console.log(today);

      // Initialising start and end date
      var start = yearBackFromNow;
      var end = today;

      // Calling the utcMonths() function
      // without step value
      // var a = d3.utcMonths(start, end);

      // Getting the months values
      // console.log(a);

      const month = year
        .append("g")
        .selectAll("g")
        // .data(([, values]) => {
        //   console.log(new Date(yearBackFromNow).getUTCMonth(), new Date(today).getUTCMonth());
        //   // console.log(new Date(data[0].date));

        //   return d3.utcMonths(start, end);
        //   // return d3.utcMonths('Feb', 'Dec');
        // })
        .data(([, values]) => {
          return d3.utcMonths(
            d3.utcMonth(new Date(values[0].date)),
            new Date(values[values.length - 1].date)
            // d3.utcMonth(new Date(values[0].date)),
            // isXL ? endMonthText : new Date(values[values.length - 1].date)
          );
        })
        .join("g");

      month
        .append("text")
        .attr("x", (d) => {
          return timeWeek.count(d3.utcYear(d), timeWeek.ceil(d)) * cellSize + 2;
        })
        .attr("y", -5)
        .attr("class", "month")
        .style("font-size", "12px")
        .text(formatMonth);
    }
  }, [fullYearData]);

  return (
    <>
      <div id="chart" ref={chartRef}></div>
    </>
  );
};

export default Heatmap;
这是我传递的示例数据:
  const data = [
    {
      date: "2021-01-01",
      contributions: 10,
      details: {
        visits: 16,
        submissions: 5,
        notebooks: 1,
        discussions: 4
      }
    },
    {
      date: "2021-01-02",
      contributions: 10,
      details: {
        visits: 16,
        submissions: 5,
        notebooks: 1,
        discussions: 4
      }
    },
    {
      date: "2021-01-05",
      contributions: 5,
      details: {
        visits: 16,
        submissions: 5,
        notebooks: 1,
        discussions: 4
      }
    },
    {
      date: "2021-02-05",
      contributions: 3,
      details: {
        visits: 16,
        submissions: 5,
        notebooks: 1,
        discussions: 4
      }
    }
  ];