我创建了一个声学数据的圆形热力图,每个圆环层代表同一天,圆环被分为24个部分,分别代表一天中的24小时。我想实现这样一个功能:当鼠标悬停在某个圆环上时,增加该日期所有圆环段的高度,同时相应地减小其他圆环段的高度,以保持弧半径不变。目前,我只能选择同一日期的所有圆环段,但我无法找到如何操作高度的方法。有人可以指导我吗?
以下是图片链接,当你悬停在某个圆环段上时会出现如下效果: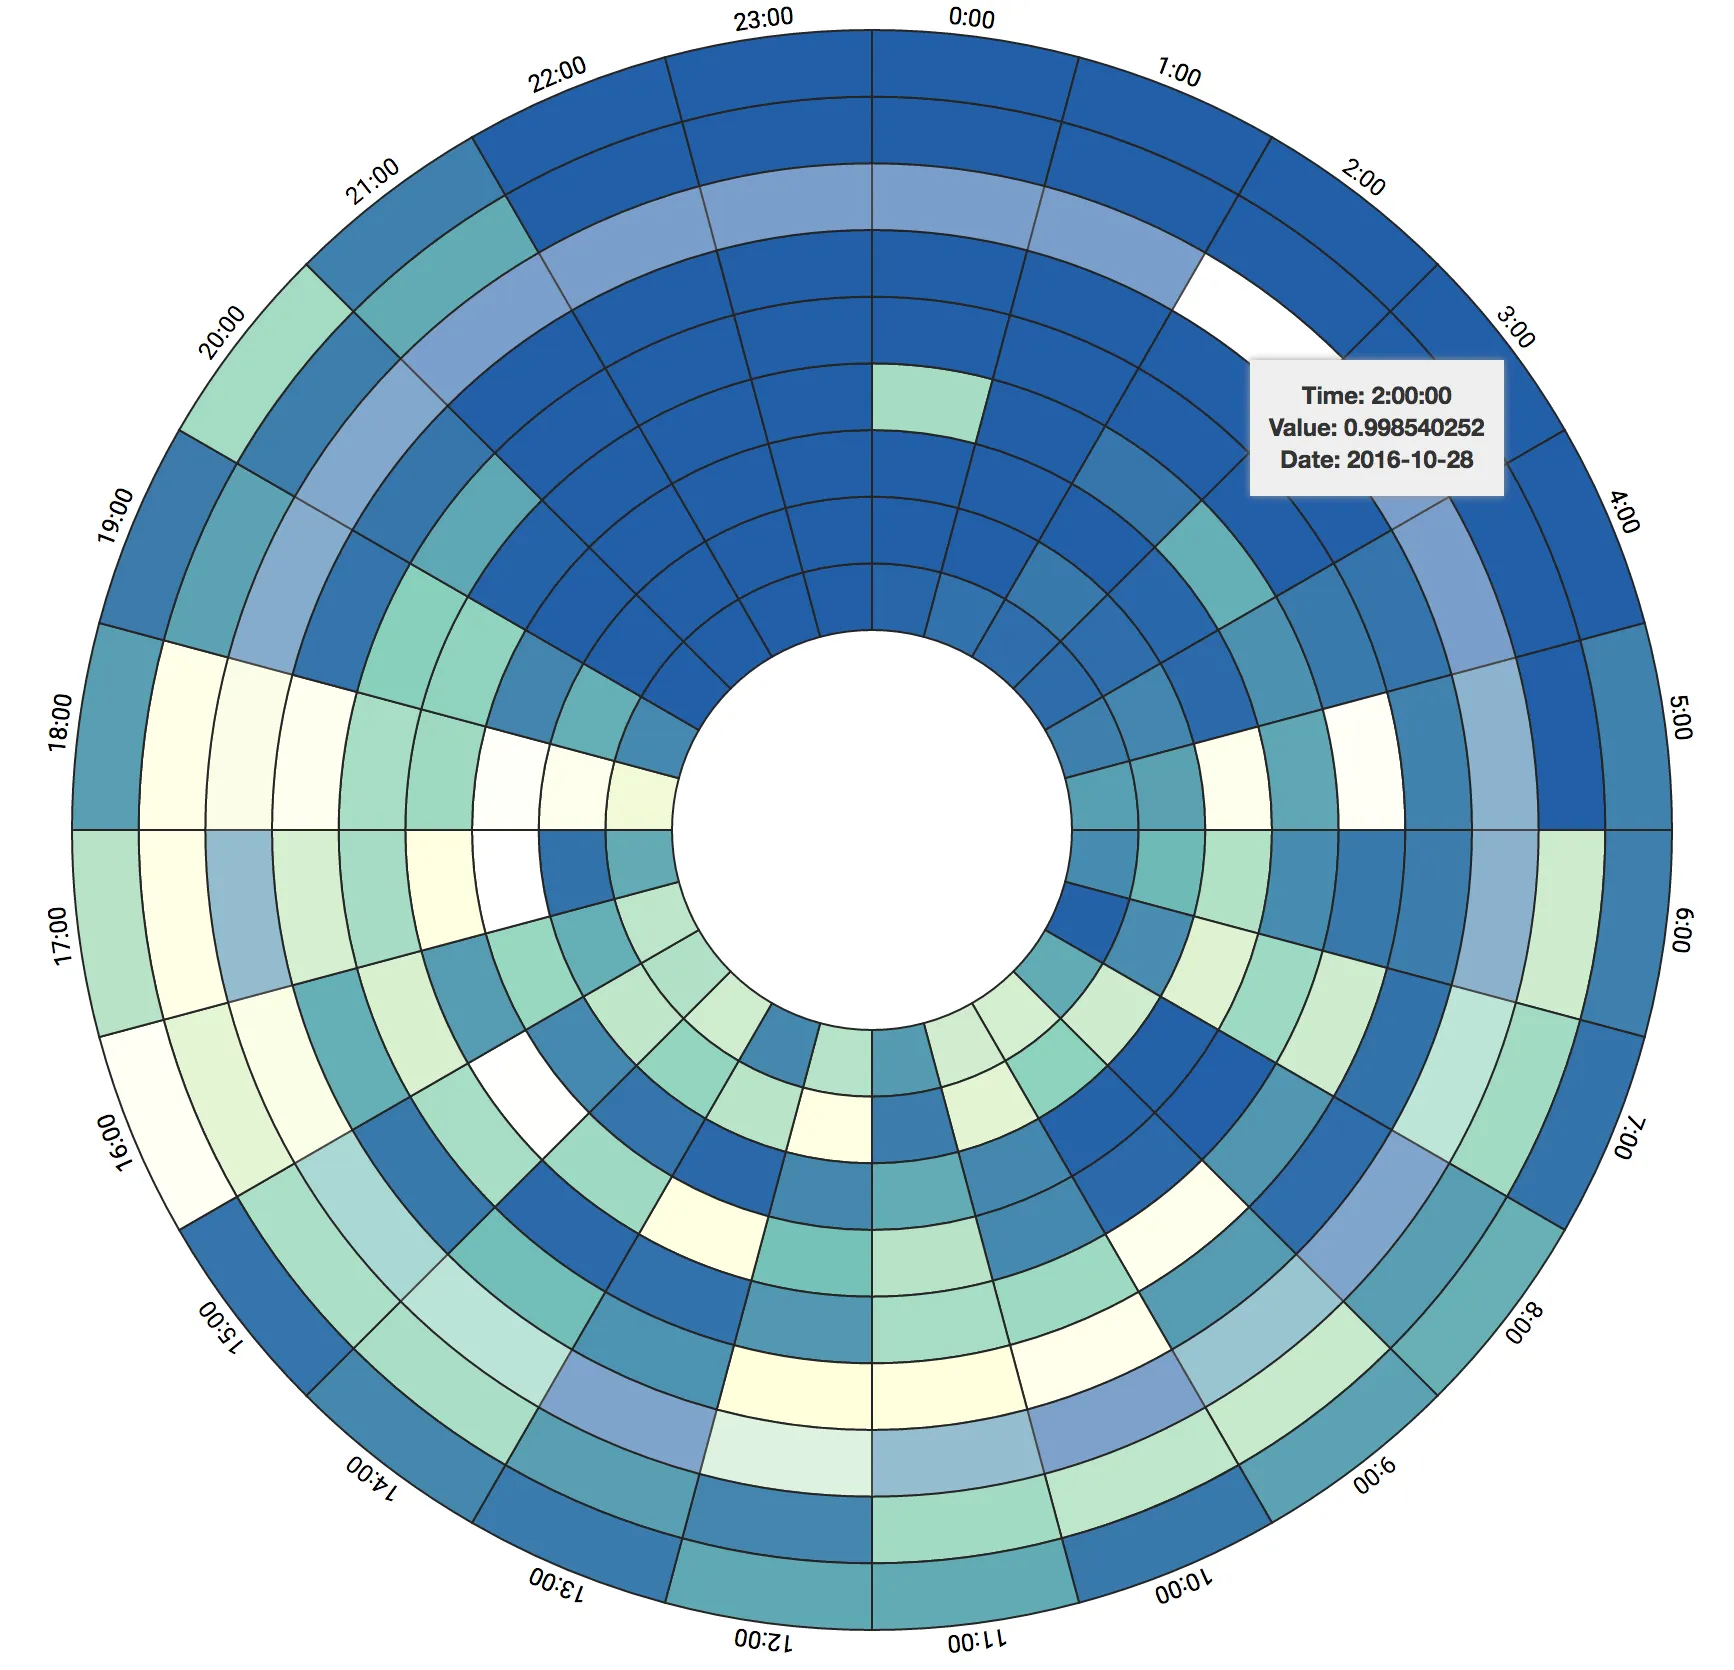 以下是我的代码:
以下是图片链接,当你悬停在某个圆环段上时会出现如下效果:
以下是我的代码: var radial_labels = ['2016-10-22', '2016-10-23', '2016-10-24', '2016-10-25', '2016-10-26', '2016-10-27', '2016-10-28', '2016-10-29', '2016-10-30'];
var segment_labels = ['0:00', '1:00', '2:00', '3:00', '4:00', '5:00', '6:00', '7:00', '8:00', '9:00', '10:00', '11:00','12:00','13:00','14:00','15:00','16:00','17:00','18:00','19:00','20:00','21:00','22:00','23:00'];
loadCircularHeatMap(data,"#chart",radial_labels, segment_labels);
function loadCircularHeatMap (dataset, dom_element_to_append_to,radial_labels,segment_labels) {
var margin = {top: 50, right: 50, bottom: 50, left: 50};
var width = 1000 - margin.left - margin.right;
var height = width;
var innerRadius = 100;// width/14;
var segmentHeight = (width - margin.top - margin.bottom - 2*innerRadius )/(2*radial_labels.length);
var chart = circularHeatChart()
.innerRadius(innerRadius)
.segmentHeight(segmentHeight)
.domain([0,0.5,1])
.range(["#ffffd9", "#7fcdbb" ,"#225ea8"])
.radialLabels(radial_labels)
.segmentLabels(segment_labels);
chart.accessor(function(d) {return d.Average;})
var svg = d3.select(dom_element_to_append_to)
.selectAll('svg')
.data([dataset])
.enter()
.append('svg')
.attr("width", width + margin.left + margin.right)
.attr("height", height + margin.top + margin.bottom)
.append('g')
.attr("transform",
"translate(" + ( (width )/2 - (radial_labels.length*segmentHeight + innerRadius) ) + "," + margin.top + ")")
.call(chart);
var tooltip = d3.select(dom_element_to_append_to)
.append('div')
.attr('class', 'tooltip');
tooltip.append('div')
.attr('class', 'time');
tooltip.append('div')
.attr('class', 'average');
tooltip.append('div')
.attr('class', 'day');
svg.selectAll("path")
.on('mouseover', function(d) {
console.log(d.Day);
// increase the segment height of the one being hovered as well as all others of the same date
// while decreasing the height of all others accordingly
d3.selectAll("path.segment-"+d.Day).style("opacity", function (p) {return 0.6});
tooltip.select('.time').html("<b> Time: " + d.Time + "</b>");
tooltip.select('.day').html("<b> Date: " + d.Day + "</b>");
tooltip.select('.average').html("<b> Value: " + d.Average + "</b>");
tooltip.style('display', 'block');
tooltip.style('opacity',2);
})
.on('mousemove', function(d) {
tooltip.style('top', (d3.event.layerY + 10) + 'px')
.style('left', (d3.event.layerX - 25) + 'px');
})
.on('mouseout', function(d) {
tooltip.style('display', 'none');
tooltip.style('opacity',0);
// var time = d.Time;
// var timeCleaned = time.split(":").join("-");
// var segment = d3.select("#segment-"+d.Day +"-"+timeCleaned); //designate selector variable for brevity
// var fillcolor = segment.select("desc").text(); //access original color from desc
// segment.style("fill", fillcolor);
d3.selectAll("path.segment-"+d.Day).style("opacity", function (p) {return 1});
})
.append("desc") //append the current color as a desc element
.text(function(d){
var color = d3.scale.linear().domain([0,0.5,1]).range(["#ffffd9", "#7fcdbb" ,"#225ea8"]);
// how to access a function within reusable charts
console.log(color(d.Average));
return color(d.Average);
});
}
function circularHeatChart() {
var margin = {top: 20, right: 50, bottom: 50, left: 20},
innerRadius = 20,
numSegments = 24,
segmentHeight = 20,
domain = null,
range = ["white", "red"],
accessor = function(d) {return d;},
radialLabels = segmentLabels = [];
function chart(selection) {
selection.each(function(data) {
var svg = d3.select(this);
var offset = innerRadius + Math.ceil(data.length / numSegments) * segmentHeight;
g = svg.append("g")
.classed("circular-heat", true)
.attr("transform", "translate(" + parseInt(margin.left + offset) + "," + parseInt(margin.top + offset) + ")");
var autoDomain = false;
if (domain === null) {
domain = d3.extent(data, accessor);
autoDomain = true;
}
var color = d3.scale.linear().domain(domain).range(range);
if(autoDomain)
domain = null;
g.selectAll("path").data(data)
.enter().append("path")
// .attr("class","segment")
.attr("class",function(d){return "segment-"+d.Day})
.attr("id",function(d){
var time = d.Time;
var timeCleaned = time.split(":").join("-");
return "segment-"+d.Day +"-"+timeCleaned;})
.attr("d", d3.svg.arc().innerRadius(ir).outerRadius(or).startAngle(sa).endAngle(ea))
.attr("stroke", function(d) {return '#252525';})
.attr("fill", function(d) {return color(accessor(d));});
// Unique id so that the text path defs are unique - is there a better way to do this?
var id = d3.selectAll(".circular-heat")[0].length;
//Segment labels
var segmentLabelOffset = 5;
var r = innerRadius + Math.ceil(data.length / numSegments) * segmentHeight + segmentLabelOffset;
labels = svg.append("g")
.classed("labels", true)
.classed("segment", true)
.attr("transform", "translate(" + parseInt(margin.left + offset) + "," + parseInt(margin.top + offset) + ")");
labels.append("def")
.append("path")
.attr("id", "segment-label-path-"+id)
.attr("d", "m0 -" + r + " a" + r + " " + r + " 0 1 1 -1 0");
labels.selectAll("text")
.data(segmentLabels).enter()
.append("text")
.append("textPath")
.attr("xlink:href", "#segment-label-path-"+id)
.style("font-size", "12px")
.attr("startOffset", function(d, i) {return i * 100 / numSegments + 1.5+ "%";})
.text(function(d) {return d;});
});
}
/* Arc functions */
ir = function(d, i) {
return innerRadius + Math.floor(i/numSegments) * segmentHeight;
}
or = function(d, i) {
return innerRadius + segmentHeight + Math.floor(i/numSegments) * segmentHeight;
}
sa = function(d, i) {
return (i * 2 * Math.PI) / numSegments;
}
ea = function(d, i) {
return ((i + 1) * 2 * Math.PI) / numSegments;
}
/* Configuration getters/setters */
chart.margin = function(_) {
if (!arguments.length) return margin;
margin = _;
return chart;
};
chart.innerRadius = function(_) {
if (!arguments.length) return innerRadius;
innerRadius = _;
return chart;
};
chart.numSegments = function(_) {
if (!arguments.length) return numSegments;
numSegments = _;
return chart;
};
chart.segmentHeight = function(_) {
if (!arguments.length) return segmentHeight;
segmentHeight = _;
return chart;
};
chart.domain = function(_) {
if (!arguments.length) return domain;
domain = _;
return chart;
};
chart.range = function(_) {
if (!arguments.length) return range;
range = _;
return chart;
};
chart.radialLabels = function(_) {
if (!arguments.length) return radialLabels;
if (_ == null) _ = [];
radialLabels = _;
return chart;
};
chart.segmentLabels = function(_) {
if (!arguments.length) return segmentLabels;
if (_ == null) _ = [];
segmentLabels = _;
return chart;
};
chart.accessor = function(_) {
if (!arguments.length) return accessor;
accessor = _;
return chart;
};
return chart;
}