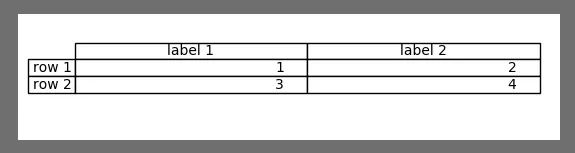
由于表格是在坐标轴内创建的,因此最终的绘图大小将取决于坐标轴的大小。因此,原则上的解决方案可以是先设置图形大小或坐标轴大小,然后让表格适应它。
import matplotlib.pyplot as plt

fig = plt.figure(figsize=(6,1))

t_data = ((1,2), (3,4))
table = plt.table(cellText = t_data,
                  colLabels = ('label 1', 'label 2'),
                  rowLabels = ('row 1', 'row 2'),
                  loc='center')

plt.axis('off')
plt.grid('off')

plt.savefig(__file__+'test2.png', bbox_inches="tight" )
plt.show()
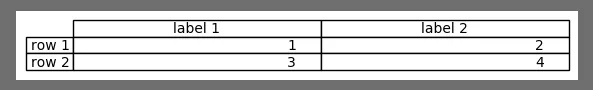
另一种解决方案是让表格保持原状,并在保存前找出表格的边框框。这样可以创建一个真正紧贴表格的图像。
import matplotlib.pyplot as plt
import matplotlib.transforms
t_data = ((1,2), (3,4))
table = plt.table(cellText = t_data,
colLabels = ('label 1', 'label 2'),
rowLabels = ('row 1', 'row 2'),
loc='center')
plt.axis('off')
plt.grid('off')
plt.gcf().canvas.draw()
points = table.get_window_extent(plt.gcf()._cachedRenderer).get_points()
points[0,:] -= 10; points[1,:] += 10
nbbox = matplotlib.transforms.Bbox.from_extents(points/plt.gcf().dpi)
plt.savefig(__file__+'test.png', bbox_inches=nbbox, )
plt.show()