我想使用facet_wrap绘制一个ggplot,其中不显示实际表格百分比,而是每个组中给定答案的百分比。我必须这样做,因为我想展示每个组中最常选择和最重要的答案是什么。这些组的大小不同。
数据示例:
group <- c(rep(c("Group1"), times = 10),rep(c("Group2"), times = 6),rep(c("Group3"), times = 4))
choice <- c(rep(c("a","b","c"),length.out = 10), "a","a","a","a","b","c","b","b","b","c")
df <- data.frame(cbind(group,choice))
希望我能只使用
prop.c而不是整体的prop.t来展示我的图表,这样更能准确地显示例如66.67%的第二组选择方案A。library(gmodels)
CrossTable(choice, group, prop.chisq=FALSE, prop.t = TRUE, prop.c = TRUE, prop.r = FALSE, format = "SPSS")
这是有关绘图的内容:
library(ggplot2)
g <- ggplot(df, aes_string(x="group", fill="group")) +
            geom_bar(aes(y = (..count..)/sum(..count..)))+
            ylab("percent")
g + facet_wrap(~ choice)
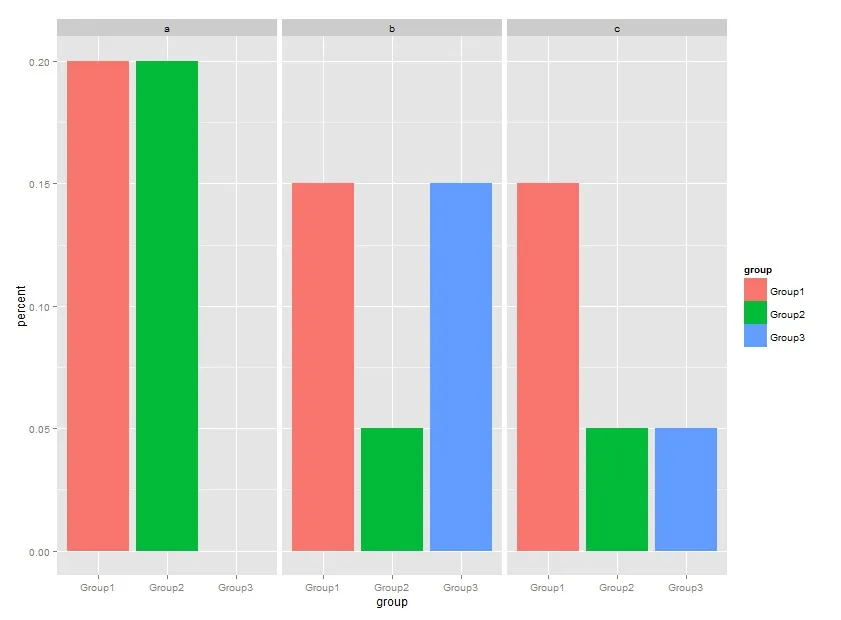
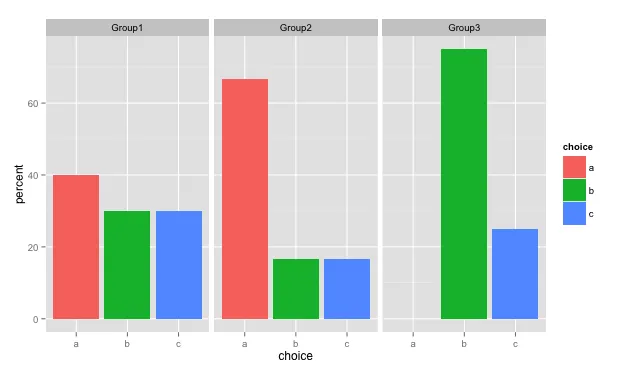
现在第一根柱子显示为:20%,20%,0%,但应该显示为40%,66.67%和0%(每个组中给出此答案的人数百分比)。
对于第二根柱子应该显示为:30%,16.667%和75%。
而第三根柱子应该显示为:30%,16.667%和25%。
感谢您的帮助。