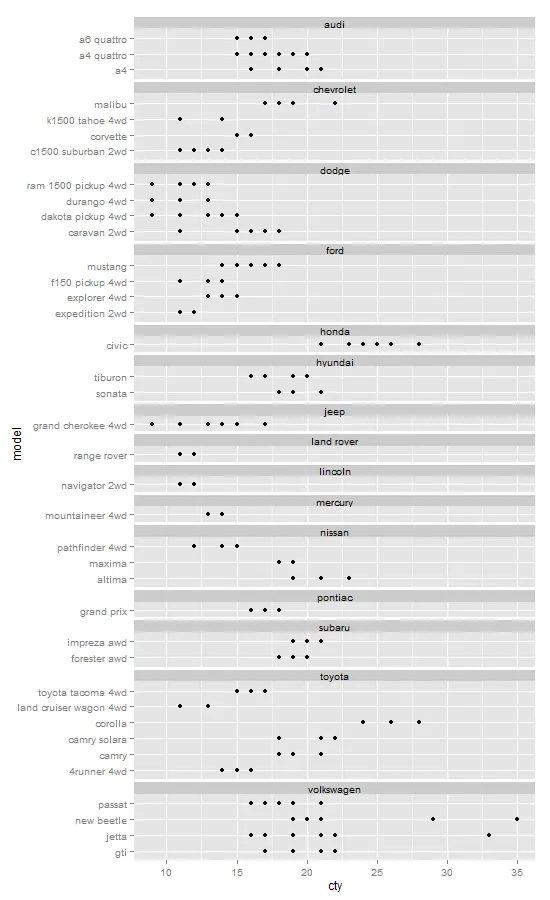
这是您的第一种方法。它在每个面板上方插入一行,获取条形图(右侧)并将其插入新行中。
library(ggplot2)
library(gtable)
library(grid)
mt <- ggplot(mpg, aes(x = cty, y = model)) + geom_point() +
facet_grid(manufacturer ~ ., scales = 'free', space = 'free') +
theme(panel.spacing = unit(0.5, 'lines'),
strip.text.y = element_text(angle = 0))
gt <- ggplotGrob(mt)
panels <-c(subset(gt$layout, grepl("panel", gt$layout$name), se=t:r))
for(i in rev(panels$t-1)) gt = gtable_add_rows(gt, unit(.5, "lines"), i)
panels <-c(subset(gt$layout, grepl("panel", gt$layout$name), se=t:r))
strips <- c(subset(gt$layout, grepl("strip-r", gt$layout$name), se=t:r))
stripText = gtable_filter(gt, "strip-r")
for(i in 1:length(strips$t)) gt = gtable_add_grob(gt, stripText$grobs[[i]]$grobs[[1]], t=panels$t[i]-1, l=4)
gt = gt[,-5]
for(i in panels$t) {
gt$heights[i-1] = unit(0.8, "lines")
gt$heights[i-2] = unit(0.2, "lines")
}
grid.newpage()
grid.draw(gt)
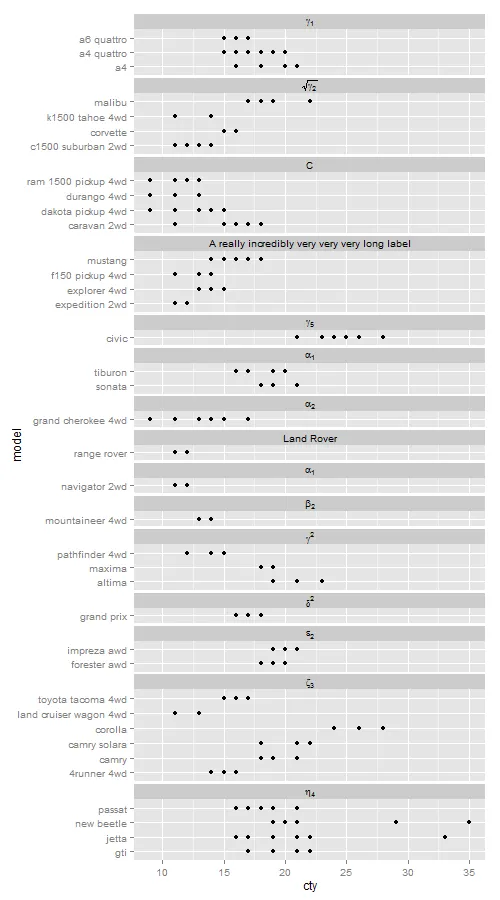
或者,您可以使用facet_wrap_labeller函数(从这里获取)来实现第二种方法。
library(ggplot2)
library(gtable)
mt <- ggplot(mpg, aes(x = cty, y = model)) + geom_point() +
facet_wrap(~ manufacturer, scales = "free_y", ncol = 1) +
theme(panel.margin = unit(0.2, 'lines'))
facet_wrap_labeller <- function(gg.plot, labels=NULL) {
require(gridExtra)
g <- ggplotGrob(gg.plot)
gg <- g$grobs
strips <- grep("strip_t", names(gg))
for(ii in seq_along(labels)) {
modgrob <- getGrob(gg[[strips[ii]]], "strip.text",
grep=TRUE, global=TRUE)
gg[[strips[ii]]]$children[[modgrob$name]] <- editGrob(modgrob,label=labels[ii])
}
g$grobs <- gg
class(g) = c("arrange", "ggplot",class(g))
return(g)
}
g <- ggplot_build(mt)
N <- sapply(lapply(g$panel$ranges, "[[", "y.major"), length)
StripTexts = expression(gamma[1], sqrt(gamma[2]), C, `A really incredibly very very very long label`, gamma[5], alpha[1], alpha[2], `Land Rover`, alpha[1], beta[2], gamma^2, delta^2, epsilon[2], zeta[3], eta[4] )
gt = facet_wrap_labeller(mt, StripTexts)
panels <- gt$layout$t[grepl("panel", gt$layout$name)]
gt$heights[panels] <- lapply(N, unit, "null")
gt

for(i in 1:length(strips$t)) gt = gtable_add_grob(gt, stripText$grobs[[i]], t=panels$t[i]-1, l=4, r=4)->for(i in 1:length(strips$t)) gt = gtable_add_grob(gt, stripText$grobs[[i]], t=panels$t[i]-1, l=min(panels$l), r=max(panels$r))来插入新的条带grobs和gt = gt[,-5]->gt <- gt[,-c(min(strips$l), max(strips$r))]去除旧的条带。 - Tom Harrop