使用facet_grid时如何将标签放在图形顶部?或者使用facet_wrap中的空间选项怎么做?

12

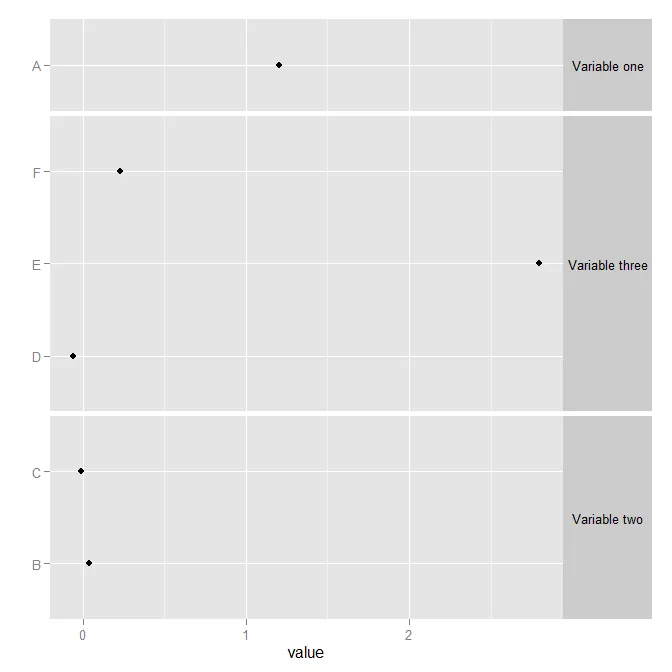
facet_grid 允许我根据y轴上的项目数量(space参数)调整每个小面板的宽度:

df <- data.frame(label = c("Variable one", rep("Variable two", 2), rep("Variable three", 3)), item = c("A", "B", "C", "D", "E", "F"), value = rnorm(6))
ggplot(df, aes(x = value, y = item)) + 
geom_point() + 
facet_grid(label ~ ., scales = "free_y", space = "free_y") + 
ylab("") + 
theme(strip.text.y = element_text(angle=0))

在这里输入图片描述

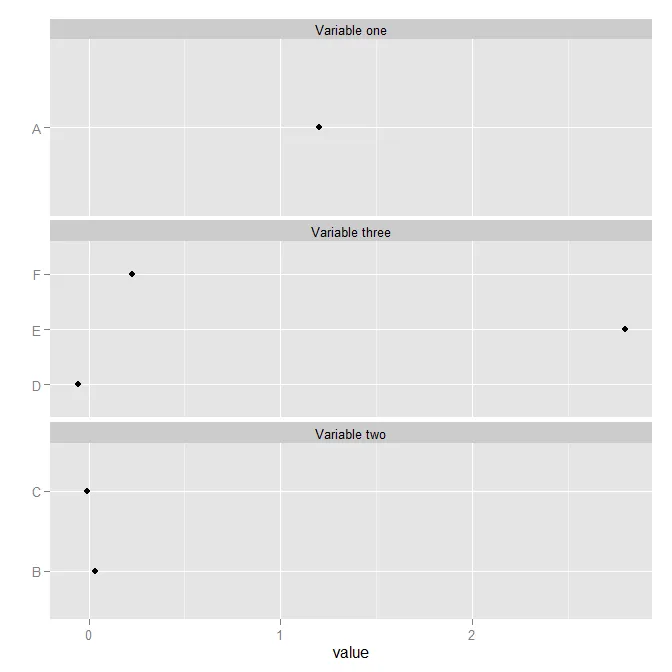
但是我希望在顶部显示facet标签,因此我切换到facet_wrap,并且失去了space参数(facets具有相同的宽度):

ggplot(df, aes(x = value, y = item)) + 
geom_point() + 
facet_wrap(~ label, scales = "free_y", ncol = 1) + 
ylab("")

enter image description here

能否兼得两全?

提前感谢您的帮助。

3个回答

9

我认为这个功能不存在或者不打算在ggplot2中实现(参见此已关闭的问题讨论此功能)

然而,ggforce包支持你需要的功能。

library(ggplot2)
library(ggforce)
df <- data.frame(label = c("Variable one", rep("Variable two", 2), rep("Variable three", 3)), item = c("A", "B", "C", "D", "E", "F"), value = rnorm(6))
  
ggplot(df, aes(x = value, y = item)) + 
  geom_point() + 
  ggforce::facet_col(facets = vars(label), 
                     scales = "free_y", 
                     space = "free") +
  ylab("") + 
  theme(strip.text.y = element_text(angle=0))

本示例由 reprex软件包 (v0.3.0) 于2020-06-28创建


1
谢谢分享!很棒的功能。我知道示例图是这样的,但是有一个小小的提示:使用
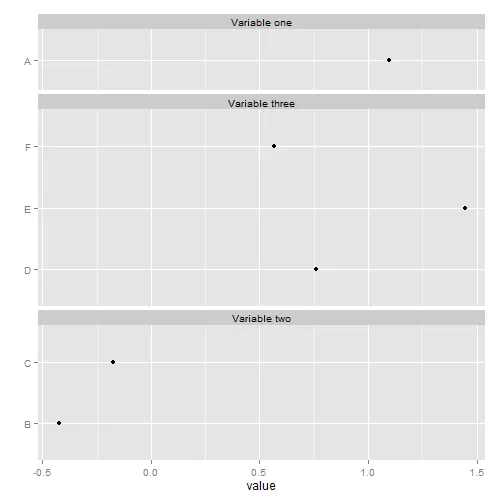
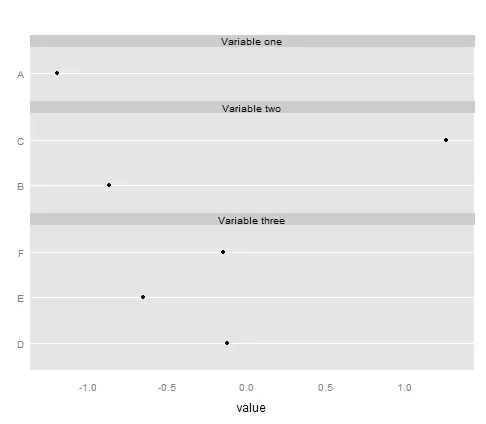
labs(y = NULL)来删除标签标题,这样实际上将不会绘制任何内容。否则,那里仍然会有"某些东西"存在。+1 - tjebo
1
有没有办法在所有面板上保留x轴标签?我正在制作一个日历,我希望每个面板都有星期几的标签。 - Nova
使用此示例,类似于: ggforce::facet_col(facets = vars(label), scales = "free", space = "free") + scale_x_continuous(breaks = seq(-1, 1, 1), limits = c(-1, 1)) - John-Henry

5

这项工作可以手动完成。期望图形中三个面板的高度比大致为1:3:2。可以通过更改grobs来调整三个面板的高度:

library(ggplot2)
library(grid)
df <- data.frame(label = c("Variable one", rep("Variable two", 2), rep("Variable three", 3)), item = c("A", "B", "C", "D", "E", "F"), value = rnorm(6))

p1 = ggplot(df, aes(x = value, y = item)) + 
geom_point() + 
facet_wrap(~ label, scales = "free_y", ncol = 1) + 
ylab("")

g1 = ggplotGrob(p1) 

g1$heights[[7]] = unit(1, "null")
g1$heights[[12]] = unit(3, "null")
g1$heights[[17]] = unit(2, "null")

grid.newpage()
grid.draw(g1)

或者,高度可以设置为与原始图形中的高度相同:
p2 = ggplot(df, aes(x = value, y = item)) + 
geom_point() + 
facet_grid(label ~ ., scales = "free_y", space = "free_y") + 
ylab("") + 
theme(strip.text.y = element_text(angle=0))

g2 = ggplotGrob(p2) 

g1$heights[[7]] = g2$heights[[6]]
g1$heights[[12]] = g2$heights[[8]]
g1$heights[[17]] = g2$heights[[10]]

grid.newpage()
grid.draw(g1)

或者,高度可以不参考原始图表进行设置。它们可以根据 df 中每个 labelitems 数量进行设置。并且从@baptiste在这里的回答中借用一些代码来选择与面板对应的布局项:

# From 'df', get the number of 'items' for each 'label'.
# That is, the number y-breaks in each panel.
library(plyr)
N = dlply(df, .(label), function(x) length(row.names(x)))

# Get the items in the g1 layout corresponding to the panels.
panels1 <- g1$layout$t[grepl("panel", g1$layout$name)]

# Replace the default panel heights with relative heights
g1$heights[panels1] <- unit(N, "null")

## Draw g1
grid.newpage()
grid.draw(g1)

enter image description here


4

我不知道如何在 ggplot 中实现,但你可以使用 latticeExtra 来实现类似的布局,它具有与 ggplot 相似的样式:

library(latticeExtra)
df$label <- factor(df$label, levels = unique(df$label))

dotplot(item ~ value | label, data = df,
        layout = c(1, 3),
        as.table = TRUE,
        scales = list(y = list(relation = "free")),
        par.settings = ggplot2like())
resizePanels()

enter image description here


网页内容由stack overflow 提供, 点击上面的
可以查看英文原文,
原文链接