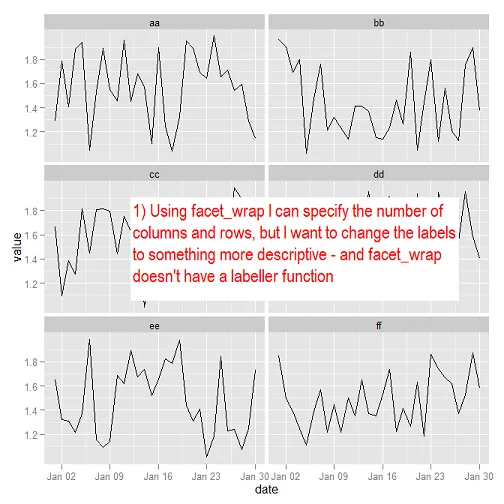
我有很多数据系列要使用小型多面板进行绘图。 使用ggplot2和facet_wrap的组合可以实现我的目标,通常会得到一个6 x 6小面板的漂亮块。这是一个更简单的版本:
facet_grid来利用labeller函数,但是似乎没有直接的方法来指定列数,而且一长行的facets对于这个特定任务来说并不适用。我是否忽略了一些明显的东西?
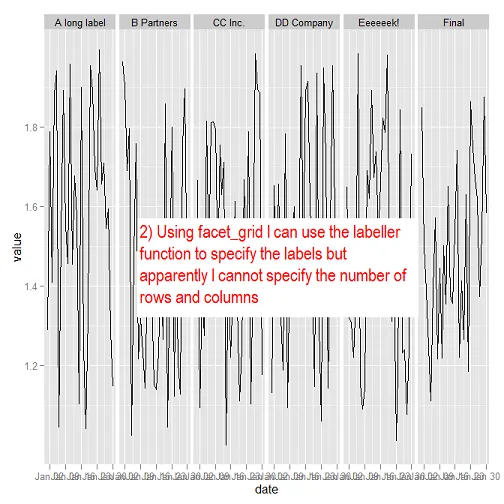
问:如何在使用facet_wrap时更改facet标签而不更改列名?或者在使用facet_grid时如何指定列数和行数?
以下是简化示例的代码。在实际情况中,我正在处理包含数十个数据系列的多个组,每个组都经常发生变化,因此任何解决方案都必须自动化,而不是依靠手动分配值。
require(ggplot2)
require(reshape)

# Random data with short column names
set.seed(123)
myrows <- 30
mydf <- data.frame(date = seq(as.Date('2012-01-01'), by = "day", length.out = myrows),
                   aa = runif(myrows, min=1, max=2),
                   bb = runif(myrows, min=1, max=2),
                   cc = runif(myrows, min=1, max=2),
                   dd = runif(myrows, min=1, max=2),
                   ee = runif(myrows, min=1, max=2),
                   ff = runif(myrows, min=1, max=2))

# Plot using facet wrap - we want to specify the columns
# and the rows and this works just fine, we have a little block
# of 2 columns and 3 rows

mydf <- melt(mydf, id = c('date'))

p1 <- ggplot(mydf, aes(y = value, x = date, group = variable)) +
    geom_line() +
    facet_wrap( ~ variable, ncol = 2)
print (p1)

# Problem: we want more descriptive labels without changing column names.
# We can change the labels, but doing so requires us to
# switch from facet_wrap to facet_grid
# However, in facet_grid we can't specify the columns and rows...

mf_labeller <- function(var, value){ # lifted bodily from the R Cookbook
    value <- as.character(value)
    if (var=="variable") {
        value[value=="aa"]   <- "A long label"
        value[value=="bb"]   <- "B Partners"
        value[value=="cc"]   <- "CC Inc."
        value[value=="dd"]   <- "DD Company"
        value[value=="ee"]   <- "Eeeeeek!"
        value[value=="ff"]   <- "Final"
    }
    return(value)
}

p2 <- ggplot(mydf, aes(y = value, x = date, group = variable)) +
    geom_line() +
    facet_grid( ~ variable, labeller = mf_labeller)
print (p2)