我第一次尝试使用facet_grid()。我用自己的数据绘制了直方图,当我在图表上手动计数时,分布似乎不准确。我使用mtcars数据复制了我的代码,问题似乎仍然存在。
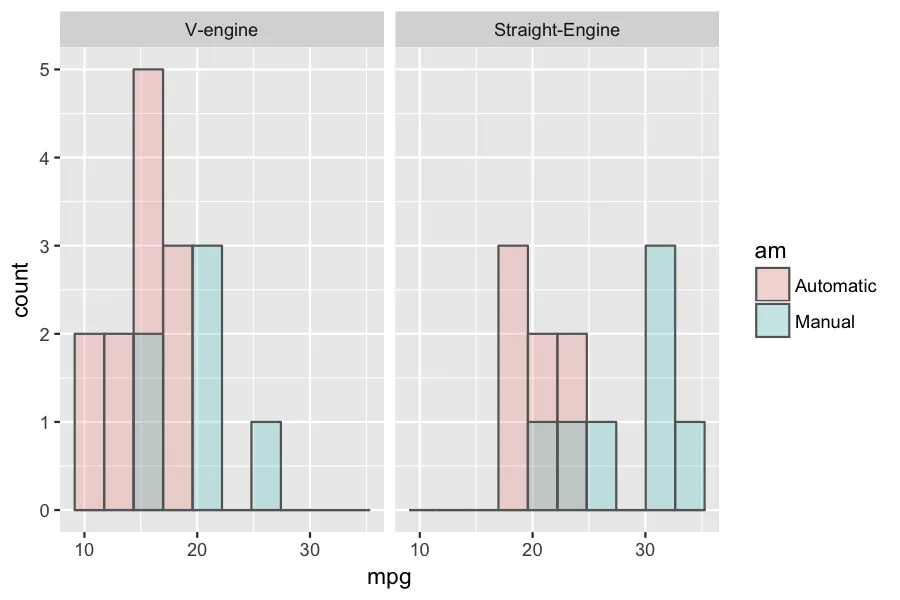
以下是ggplot生成的直方图:
dfrm <- mtcars
dfrm$am <- factor(dfrm$am, levels = c(0,1), labels = c("Automatic", "Manual"))
dfrm$vs <- factor(dfrm$vs, levels = c(0,1), labels = c("V-engine", "Straight-Engine"))

require(ggplot2)
ggplot(dfrm, aes(x=dfrm[,"mpg"], fill=dfrm[,"am"], colour=dfrm[,"am"])) +
geom_histogram(colour="transparent", position = "identity", alpha=0.2, bins = 10) +
facet_grid(. ~ dfrm[,"vs"])
当我手动在直方图上计数时,我得到以下结果:
- V型发动机,自动:14
- V型发动机,手动:4
- 直列发动机,自动:5
- 直列发动机,手动:9
这段代码计算实际数据中存在的数量:
require(pastecs)
by(data=dfrm$am, INDICES = dfrm$vs,  table)
结果如下:
- V型发动机,自动:12
- V型发动机,手动:6
- 直列式发动机,自动:7
- 直列式发动机,手动:7
我是否做错了什么?有更好的分面方法吗,还是这是一个bug?
我还使用基础包制作了直方图以检查结果是否匹配,在计算箱子数量时似乎是准确的。
hist(mtcars[which(mtcars[,"am"]==0 & mtcars[,"vs"]==0),"mpg"], xlim=c(10, 35), col=rgb(0.1,0.1,0.1,0.5), breaks=10)
hist(mtcars[which(mtcars[,"am"]==1 & mtcars[,"vs"]==0),"mpg"], col=rgb(0.8,0.8,0.8,0.5), breaks=10 ,add=T)
hist(mtcars[which(mtcars[,"am"]==0 & mtcars[,"vs"]==1),"mpg"], xlim=c(10, 35), col=rgb(0.1,0.1,0.1,0.5), breaks=10)
hist(mtcars[which(mtcars[,"am"]==1 & mtcars[,"vs"]==1),"mpg"], col=rgb(0.8,0.8,0.8,0.5), breaks=10 ,add=T)
谢谢。
===编辑===
bdemarest提供的答案解决了问题。然而,我对ggplot2偏爱的语法以及如何将其放入函数中感到困惑。 这是我要做的:
myfunc <- function(varx, dfrm, facet = F){
  require(ggplot2)
  p = ggplot(dfrm, aes(x=varx, fill=am)) +
    geom_histogram(position="identity", colour="grey40", alpha=0.2, bins = 10)
  if(!is.logical(facet)){
    p <- p + facet_grid(. ~ facet)
  }
  return(p)
}
myfunc("mpg", mtcars, facet = "vs")
我尝试过加引号和不加引号,但都无法使其工作。
=== 编辑2 ===
在评论区得到bdemarest的帮助后,我取得了很大进展,但现在填充颜色失败了,仅当ggplot在函数内部时才会失败。
这里,它能完美地工作:
facet = "vs"
p = ggplot(dfrm, aes_string(x="mpg", fill="am")) +
  geom_histogram(position="identity", colour="grey40", alpha=0.2, bins = 10)
if(!is.logical(facet)){
  p <- p + facet_grid(reformulate(facet, "."))
}
p
然而,这并不包括以下情况:
myfunc <- function(varx, dfrm, facet = FALSE){
  require(ggplot2)
  p = ggplot(dfrm, aes_string(x=varx, fill="am")) +
    geom_histogram(position="identity", colour="grey40", alpha=0.2, bins = 10)
  if(!is.logical(facet)){
    p <- p + facet_grid(reformulate(facet, "."))
  }
  return(p)
}
myfunc("mpg", mtcars, facet = "vs")
现在唯一的问题是,群组没有按颜色区分。我错过了什么吗?
aes_string()而不是aes()。按照您的函数编写方式,只需将aes更改为aes_string即可使其正常工作。 - bdemarestaes_string做到了,但现在填充颜色出了问题,我不明白原因。当我在函数外写它时,它可以工作,但当它在函数内部时就不行了。你能检查一下我的 edit2 吗?谢谢。 - nacomtcars$am是数字而不是因子引起的。要么使用已经转换为因子的数据框(dfrm),要么将fill="am"更改为fill="factor(am)"。 - bdemarest