如何在使用自由轴的facet_grid中使用coord_cartesian?

15

考虑一些 facet_grid 图形

mt <- ggplot(mtcars, aes(mpg, wt, colour = factor(cyl))) + geom_point() 
mt + facet_grid(vs ~ am, scales = "free") 

plottttt

假设我只想缩放上方的一行图,以仅显示y轴值在3到4之间的部分。 如果它们不是分面的,或者如果我想放大所有图,那么我可以使用coord_cartesian()来实现,但在这种情况下,我没有好的解决方法。 我想我可以先对数据进行子集操作,但出于很好的原因(例如,可能会影响任何统计层),这是禁忌事项。

(请注意,此问题与R:{ggplot2}:如何/可以独立地调整facet_grid图上的x轴限制?相关,但那里的答案对于此目的将无法使用。)


mt + facet_grid(vs ~ am, scales = "free") + coord_cartesian(ylim = c(3,4)) 对我来说似乎是有效的,或者我可能没有理解问题。 - mnel
你也可以使用 facet_wrap,这种情况下 x 轴也会被适当地截断 mt + facet_wrap(vs ~ am, scales = "free") + coord_cartesian(ylim = c(3,4)) - mnel
啊……只有顶行。我现在明白了。 - mnel
在使用“facet_grid”中的“shrink”参数以及某种基于“y”和分面变量的汇总函数方面如何呢? - mnel
嗯,我想我只能手动添加它们,并在每个图中设置y轴。我认为除非你想修改Hadley的代码,否则不可能实现。 - emhart
显示剩余2条评论
3个回答

14

因此,这是一个老问题,但我想分享一种我发现的方法。最简单的方法似乎是向您的数据添加人为点,例如在每个图的左下角和右上角处。将此信息放入单独的数据框中,然后使用参数alpha = 0将其添加到geom_point绘图中,以使点不可见。在facet_wrap中设置轴的缩放为"free_x"或"free_y",具体取决于您需要什么。

现在,ggplot会分别对每个面进行缩放以适应您添加的不可见点。这有点小聪明,但效果很好。


9

虽然这篇文章有些旧,但我也在寻找同样的内容,却没有找到合适的答案——也许这是使用facet_grid()设置两个依赖变量y轴限制的方法。

解决方案并不十分优雅/高效,但我认为它有效——基本上创建两个具有不同coord_cartesian调用的图形,并交换grobs即可。

# library(ggplot2)
# library(gtable)

# Plot
mt <- ggplot(mtcars, aes(mpg, wt, colour = factor(cyl))) + geom_point() 

# --------------------------------------------------------------------------------


p1 <- mt + facet_grid(vs ~ am, scales = "free") + coord_cartesian(ylim = c(1,6))
g1 <- ggplotGrob(p1)

p2 <- mt + facet_grid(vs ~ am, scales = "free") + coord_cartesian(ylim = c(3,5))
g2 <- ggplotGrob(p2)

# ----------------------------------------------------------
# Replace the upper panels and upper axis of p1 with that of p2
# Tweak panels of second plot - the upper panels
g1[["grobs"]][[6]] <- g2[["grobs"]][[6]]
g1[["grobs"]][[8]] <- g2[["grobs"]][[8]]

#Tweak axis
g1[["grobs"]][[4]] <- g2[["grobs"]][[4]]

grid.newpage()
grid.draw(g1)

1
随着ggplot2最近的2.2.1版本,列表中的grobs数量已经发生了变化,需要在示例中进行修改。 - Uwe
对于ggplot2 v3.3.0,需要修改代码为 #调整第二个图的面板-上部面板 g1 [“grobs”] [ [2]] <- g2 [“grobs”] [ [2]] g1 [“grobs”] [ [4]] <- g2 [“grobs”] [ [4]]#调整轴 g1 [“grobs”] [ [10]] <- g2 [“grobs”] [ [10]] - masher

0

我的解决方案基于@user20650提供的答案。不同之处在于使用半自动程序来查找需要用g2中的元素替换g1元素的索引。

# library(ggplot2)
# library(grid)

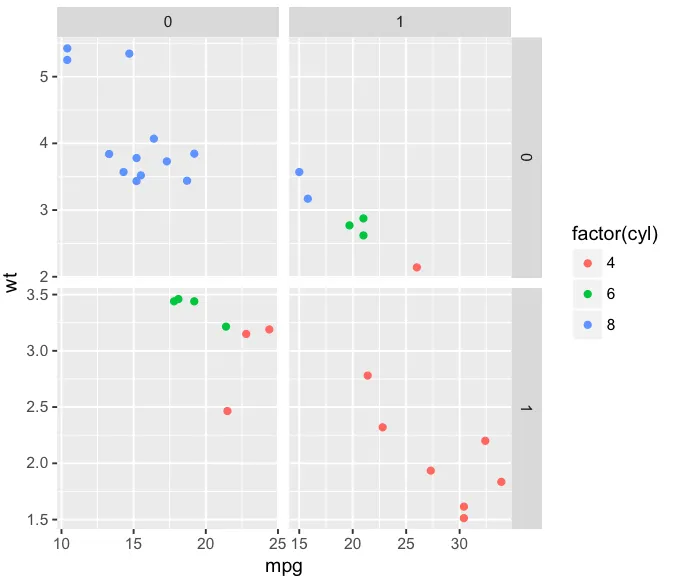
p1 <- ggplot(mtcars, aes(mpg, wt, colour = factor(cyl))) + 
  geom_point() +
  facet_grid(vs ~ am)

# modify p1 by zooming as desired
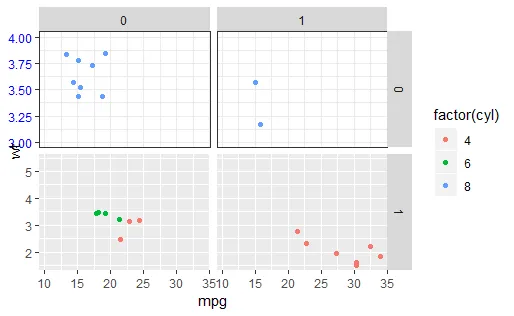
p2 <- p1 + coord_cartesian(ylim = c(3,4)) + 
  theme_bw() + 
  theme(axis.text  = element_text(color="blue"),
        strip.text = element_text(color="blue"))

p1
p2

现在我们修改顶部行的y轴限制。我们生成两个grobs g1g2,并将g1中的面板和y轴替换为g2中对应的元素。

下面的代码根据元素的名称找到要替换的grob元素的索引。

g1 <- ggplotGrob(p1)
g2 <- ggplotGrob(p2)

# Replace the upper panels and upper axis of p1 with that of p2
# i.e. replace the corresponding grobs in g1 with the versions of g2
# Panel numbering goes row-wise from top left to bottom right
panels_to_replace_with_g2 <- c(1,2)

# To get names of grobs run: lapply(g1[["grobs"]],function(x) x$name)
# Use names of grobs to find out indices of g1[["grobs"]] of the panels we want to replace
# as well as for the axis ticks.
pattern_for_specific_panels <- 
  paste0("^panel-((",paste0(panels_to_replace_with_g2, collapse = ")|("),"))")
pattern_for_axes_ticks <- 
  "^GRID.absoluteGrob"

idx_panels_to_replace_from_g2 <- which(unlist(
  lapply(g1[["grobs"]], function(x) grepl(pattern_for_specific_panels, x$name))))
# > idx_panels_to_replace_from_g2
# [1] 2 4

idx_axesTicks <- which(unlist(
  lapply(g1[["grobs"]], function(x) grepl(pattern_for_axes_ticks, x$name))))

# Find out manually which of the defined axesTicks it is:
g_test <- g1
for (itr in idx_axesTicks) {
  g_test[["grobs"]][[itr]] <- g2[["grobs"]][[itr]]
  grid.newpage();grid.draw(g_test); grid.draw(textGrob(itr, just = "top"))
  Sys.sleep(1)
}
# We found out it is itr=10
idx_axesTicks_to_replace <- 10

现在已经找到要替换的面板的索引 idx_panels_to_replace_from_g2 和 y 轴元素的索引 idx_axesTicks_to_replace。我们可以按照以下方式进行替换。
# Replace panels
grid.newpage();grid.draw(g1)
for (iter in idx_panels_to_replace_from_g2) {
  g1[["grobs"]][[iter]] <- g2[["grobs"]][[iter]]
  grid.newpage();grid.draw(g1)
  Sys.sleep(1)
}

# Replace y-axis
g1[["grobs"]][[idx_axesTicks_to_replace]] <- g2[["grobs"]][[idx_axesTicks_to_replace]]

# Render plot
grid.newpage()
grid.draw(g1)

如果成功修改了图表,现在可以删除我们应用于p2的主题修改和文本颜色,以使更改更加明显。

modified plot

未来TODO:现在缺少的是增加y轴宽度以尊重修改后的轴标签。

网页内容由stack overflow 提供, 点击上面的
可以查看英文原文,
原文链接