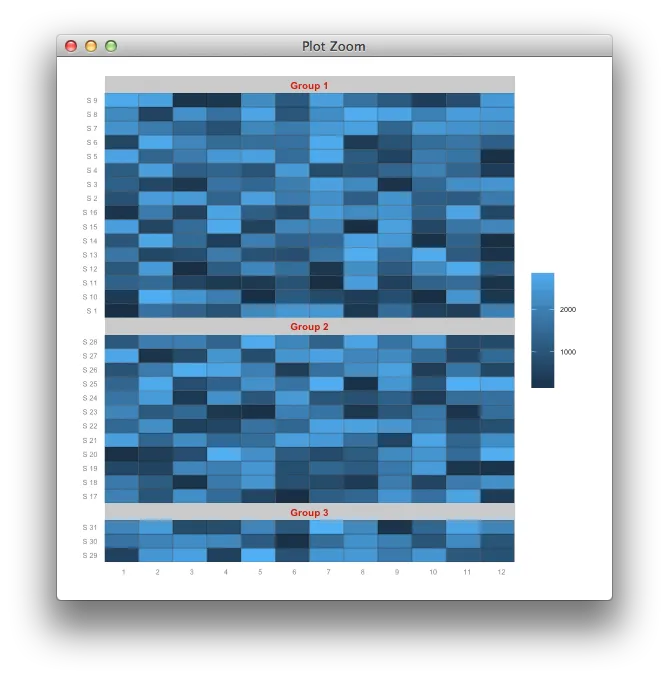
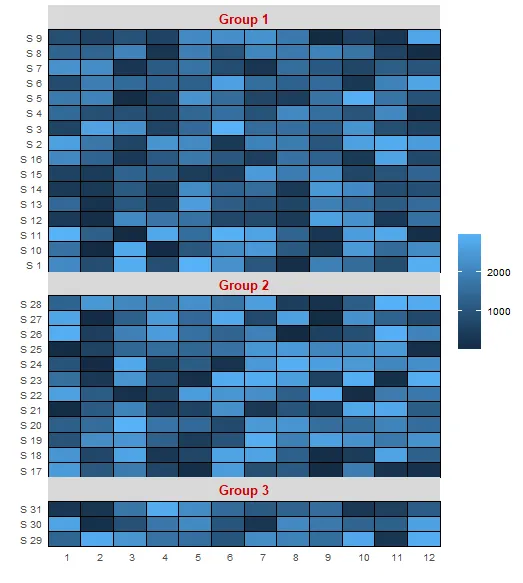
使用ggplot,我想要表示一个带有面板的图形图块,但每个面板的图块高度相同。 我有这张图:
dataSta <- list(sites=rep(paste("S", 1:31),each=12), month=rep(1:12,31), value=round(runif(31*12, min=0, max=3000)), panel=c(rep("Group 1",16*12),rep("Group 2", 12*12), rep("Group 3", 3*12)))

    library(ggplot2)
    library(grid)
    base_size <- 9

    windows()
    ggplot(data.frame(dataSta), aes(factor(month), sites)) +
      geom_tile(aes(fill = value), colour = "black")+
      facet_wrap(~panel, scale="free_y", nrow=3)+
      theme_grey(base_size = base_size) +
      labs(x = "",y = "") +
      scale_x_discrete(expand = c(0, 0)) +
      scale_y_discrete(expand = c(0, 0)) +
      theme(legend.title = element_blank(),
            axis.ticks = element_blank(),
            axis.text.x = element_text(size = base_size *0.8, hjust = 0),
            panel.margin = unit(0,"lines"),
            strip.text = element_text(colour="red3", size=10, face=2))
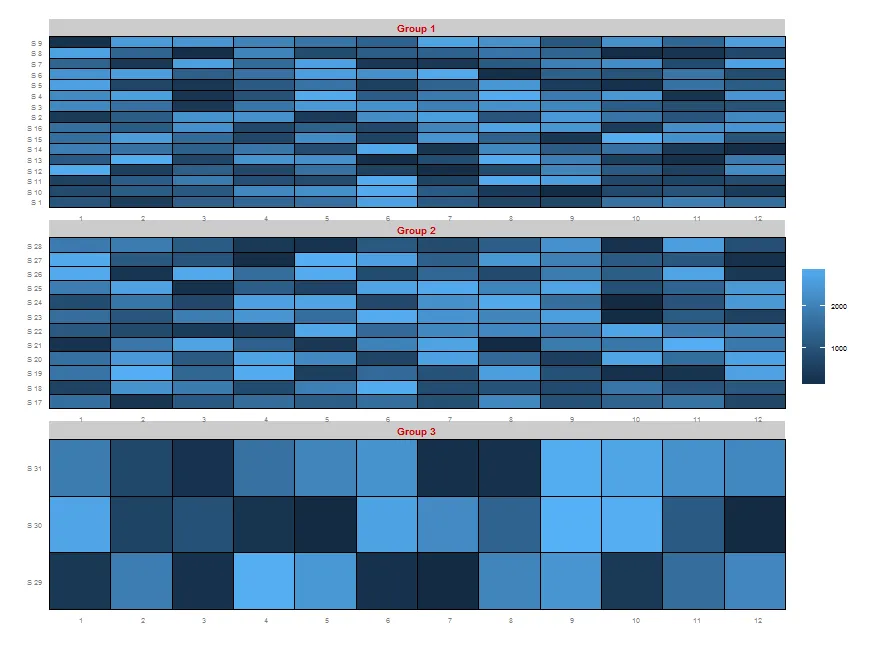
但是面板之间的瓷砖高度不同。我尝试使用 facet_grid:
windows()
ggplot(data.frame(dataSta), aes(factor(month), sites)) +
  geom_tile(aes(fill = value), colour = "black")+
  facet_grid(panel~., scales="free_y", space="free")+
  theme_grey(base_size = base_size) +
  labs(x = "",y = "") +
  scale_x_discrete(expand = c(0, 0)) +
  scale_y_discrete(expand = c(0, 0)) +
  theme(legend.title = element_blank(),
        axis.ticks = element_blank(),
        axis.text.x = element_text(size = base_size *0.8, hjust = 0),
        panel.margin = unit(0,"lines"),
        strip.text = element_text(colour="red3", size=10, face=2))
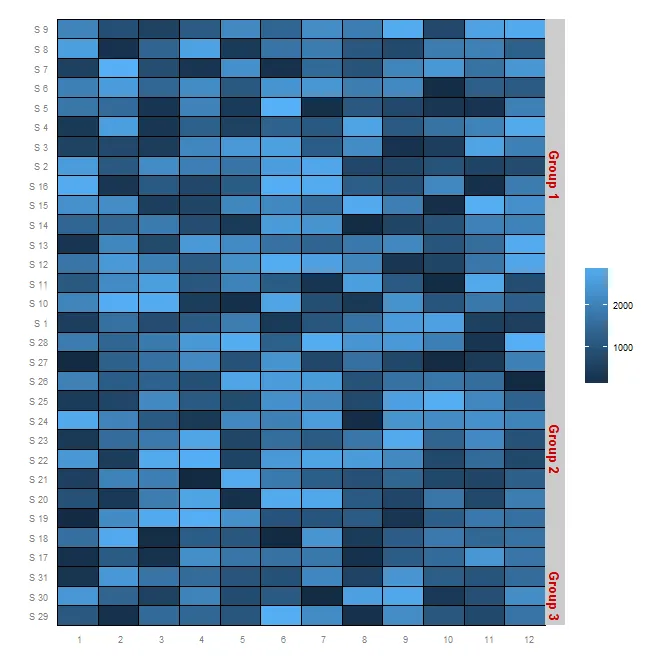 瓷砖的高度问题已经解决,但是面板的标签(Group 1... Group 3)不在面板的顶部。是否可以使用facet_grid更改面板标签的位置?或者结合facet_grid和facet_wrap?谢谢您的帮助,对不起我的英语!