我正在使用Pandas 0.10.1版本
考虑以下数据框:
Date       State   City    SalesToday  SalesMTD  SalesYTD
20130320     stA    ctA            20       400      1000
20130320     stA    ctB            30       500      1100
20130320     stB    ctC            10       500       900
20130320     stB    ctD            40       200      1300
20130320     stC    ctF            30       300       800
我该如何按州分组小计?
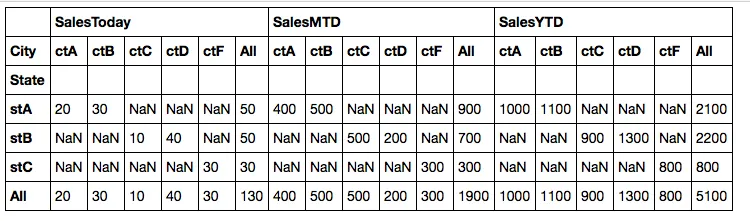
State   City  SalesToday  SalesMTD  SalesYTD
  stA    ALL          50       900      2100
  stA    ctA          20       400      1000
  stA    ctB          30       500      1100
我尝试使用数据透视表,但我只能在列中得到小计。
table = pivot_table(df, values=['SalesToday', 'SalesMTD','SalesYTD'],\
                     rows=['State','City'], aggfunc=np.sum, margins=True)
我可以用 Excel 的数据透视表来实现这个。
rows不是一个参数。我指定了一个由3列组成的索引,但输出结果只返回总计而不是索引列的小计。 - datalifenyc