我希望为生存估计的置信区间添加阴影。现在我的图表中只有黑线。
library(survival)
library(ggplot2)
library(GGally)
data(lung)
sf.sex <- survfit(Surv(time, status) ~ sex, data = lung)
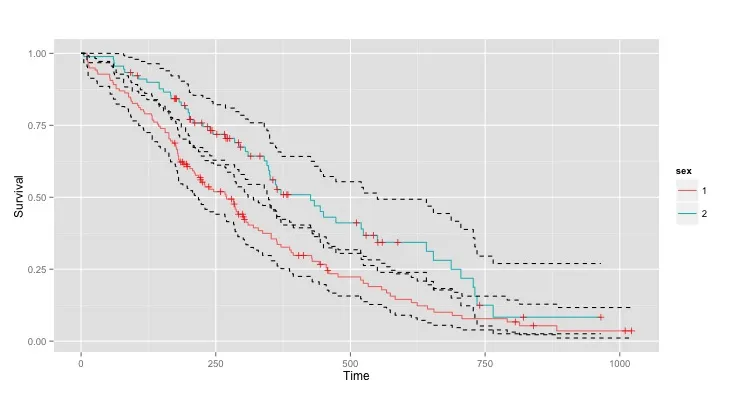
pl.sex <- ggsurv(sf.sex, CI = TRUE)
pl.sex
我希望为生存估计的置信区间添加阴影。现在我的图表中只有黑线。
library(survival)
library(ggplot2)
library(GGally)
data(lung)
sf.sex <- survfit(Surv(time, status) ~ sex, data = lung)
pl.sex <- ggsurv(sf.sex, CI = TRUE)
pl.sex
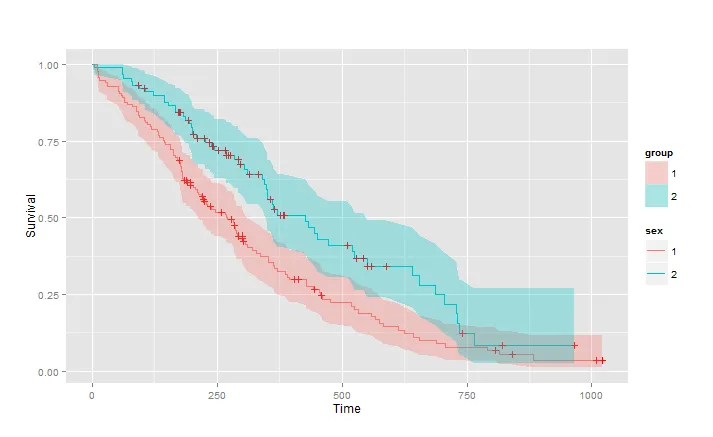
pl.sex <- ggsurv(sf.sex, CI = FALSE) +
  geom_ribbon(aes(ymin=low,ymax=up,fill=group),alpha=0.3)
将CI = FALSE设置为假以消除虚线CI带,然后添加geom_ribbon()以获得所需的置信区间带。
然而,这只是大致正确的,因为我们希望置信区间也使用阶梯函数。为了获得完全符合要求的结果,我们可以使用this link中的一些代码来创建一个名为“stepribbon”的新stat,以供geom_ribbon使用,具体如下:
library(proto)

stairstepn <- function( data, direction="hv", yvars="y" ) {
  direction <- match.arg( direction, c( "hv", "vh" ) )
  data <- as.data.frame( data )[ order( data$x ), ]
  n <- nrow( data )

  if ( direction == "vh" ) {
    xs <- rep( 1:n, each = 2 )[ -2 * n ]
    ys <- c( 1, rep( 2:n, each = 2 ) )
  } else {
    ys <- rep( 1:n, each = 2 )[ -2 * n ]
    xs <- c( 1, rep( 2:n, each = 2))
  }

  data.frame(
    x = data$x[ xs ]
    , data[ ys, yvars, drop=FALSE ]
    , data[ xs, setdiff( names( data ), c( "x", yvars ) ), drop=FALSE ]
  )
}

stat_stepribbon <- function( mapping=NULL, data=NULL, geom="ribbon", position="identity" ) {
  StatStepribbon$new( mapping=mapping, data=data, geom=geom, position=position )
}

StatStepribbon <- proto(ggplot2:::Stat, {
  objname <- "stepribbon"
  desc <- "Stepwise area plot"
  desc_outputs <- list(
    x = "stepped independent variable",
    ymin = "stepped minimum dependent variable",
    ymax = "stepped maximum dependent variable"
  )
  required_aes <- c( "x", "ymin", "ymax" )

  default_geom <- function(.) GeomRibbon
  default_aes <- function(.) aes( x=..x.., ymin = ..y.., ymax=Inf )

  calculate <- function( ., data, scales, direction = "hv", yvars = c( "ymin", "ymax" ), ...) {
    stairstepn( data = data, direction = direction, yvars = yvars )
  }

  examples <- function(.) {
    DF <- data.frame( x = 1:3, ymin = runif( 3 ), ymax=rep( Inf, 3 ) )
    ggplot( DF, aes( x=x, ymin=ymin, ymax=ymax ) ) + stat_stepribbon()
  }

})
有了这个新的stat,我认为您真正想要的解决方案就可以得到了:
pl.sex <- ggsurv(sf.sex, CI = FALSE) +
  geom_ribbon(aes(ymin=low,ymax=up,fill=group),stat="stepribbon",alpha=0.3) +
  guides(fill=guide_legend("sex"))
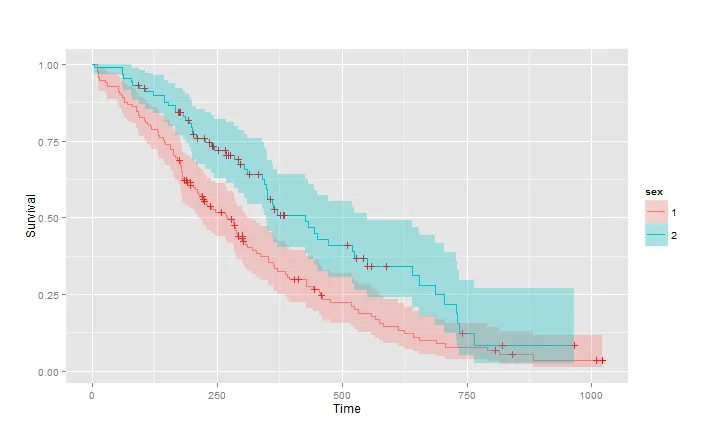
+labs(fill="sex")。 - Sam Dickson