Python制作分岔图

7

我是一名初学者,英语不太好,对此感到抱歉。 我想绘制序列的分叉图: x(n+1)=ux(n)(1-x(n)),其中x(0)=0.7,u在0.7和4之间。

我应该得到类似于这样的东西:

https://istack.dev59.com/T4gyF.webp

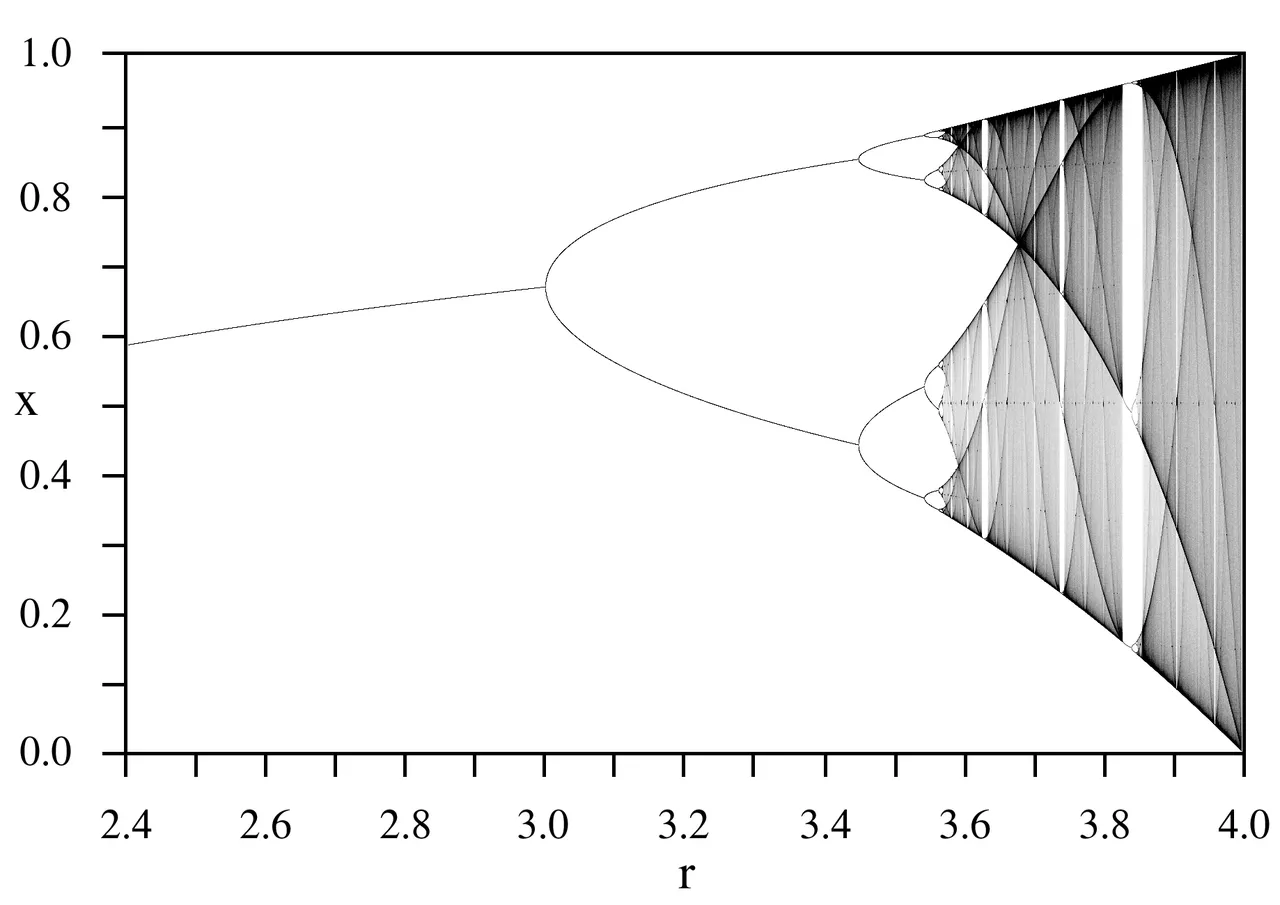
所以,对于每个u的值,我想计算这个序列的累积点。因此,我想编写一些代码,可以显示每个u的点(u;x1001),(u;x1002)...(u;x1050)。

我做了这个:

import matplotlib.pyplot as plt
import numpy as np
P=np.linspace(0.7,4,10000)
m=0.7
Y=[m]
l=np.linspace(1000,1050,51)
for u in P:
    X=[u]
    for n in range(1001):
      m=(u*m)*(1-m)
    break 
    for l in range(1051):
      m=(u*m)*(1-m)
      Y.append(m)
plt.plot(X,Y)
plt.show()

我得到了一个空白的图形。

这是我尝试编写的第一件事,我还不懂Python,所以请帮帮我。


2
请修复您代码示例的缩进。在Python中,缩进是非常重要的,而且有一些明显的错误。由于缩进问题,当前的代码无法编译。 - pcarter
你的代码缩进不正确,能修复一下吗?最简单的方法是将代码直接复制粘贴到文本框中,选择它,然后点击花括号按钮。 - Pierre de Buyl
我尝试了一些东西,但不确定是否正确(我进行了编辑),但仍然无法正常工作。这次我没有收到任何错误消息,只有一个空白的图形。感谢您的帮助。 - Killian
1
你的循环中为什么要加上 break 语句?这会导致你的 for u in P: 循环在第一次迭代的中途就结束了。 - pcarter
我以为它会停止循环“for in range(1001)”,但这并不必要,而且它停止了错误的循环。谢谢。 - Killian
2个回答

8
您的代码存在一些问题。虽然您遇到的问题是代码审查问题,但生成双分支图是一个普遍关注的问题(可能需要在scicomp上重新定位,但我不知道如何正式请求)。
import matplotlib.pyplot as plt
import numpy as np
P=np.linspace(0.7,4,10000)
m=0.7
# Initialize your data containers identically
X = []
Y = []
# l is never used, I removed it.
for u in P:
    # Add one value to X instead of resetting it.
    X.append(u)
    # Start with a random value of m instead of remaining stuck
    # on a particular branch of the diagram
    m = np.random.random()
    for n in range(1001):
      m=(u*m)*(1-m)
    # The break is harmful here as it prevents completion of
    # the loop and collection of data in Y 
    for l in range(1051):
      m=(u*m)*(1-m)
    # Collection of data in Y must be done once per value of u
    Y.append(m)
# Remove the line between successive data points, this renders
# the plot illegible. Use a small marker instead.
plt.plot(X, Y, ls='', marker=',')
plt.show()

此外,X在这里是无用的,因为它包含了P的一个副本。

1
谢谢您的时间,您的评论真的帮了我很多。我理解了我的错误并纠正了一切,现在它可以工作了!所以,再次感谢您。 - Killian

0

如果想将分叉图以png格式保存,可以尝试使用this简单的代码。

# Bifurcation diagram of the logistic map

import math
from PIL import Image
imgx = 1000
imgy = 500
image = Image.new("RGB", (imgx, imgy))

xa = 2.9
xb = 4.0
maxit = 1000

for i in range(imgx):
    r = xa + (xb - xa) * float(i) / (imgx - 1)
    x = 0.5
    for j in range(maxit):
        x = r * x * (1 - x)
        if j > maxit / 2:
            image.putpixel((i, int(x * imgy)), (255, 255, 255))

image.save("Bifurcation.png", "PNG")

网页内容由stack overflow 提供, 点击上面的
可以查看英文原文,
原文链接