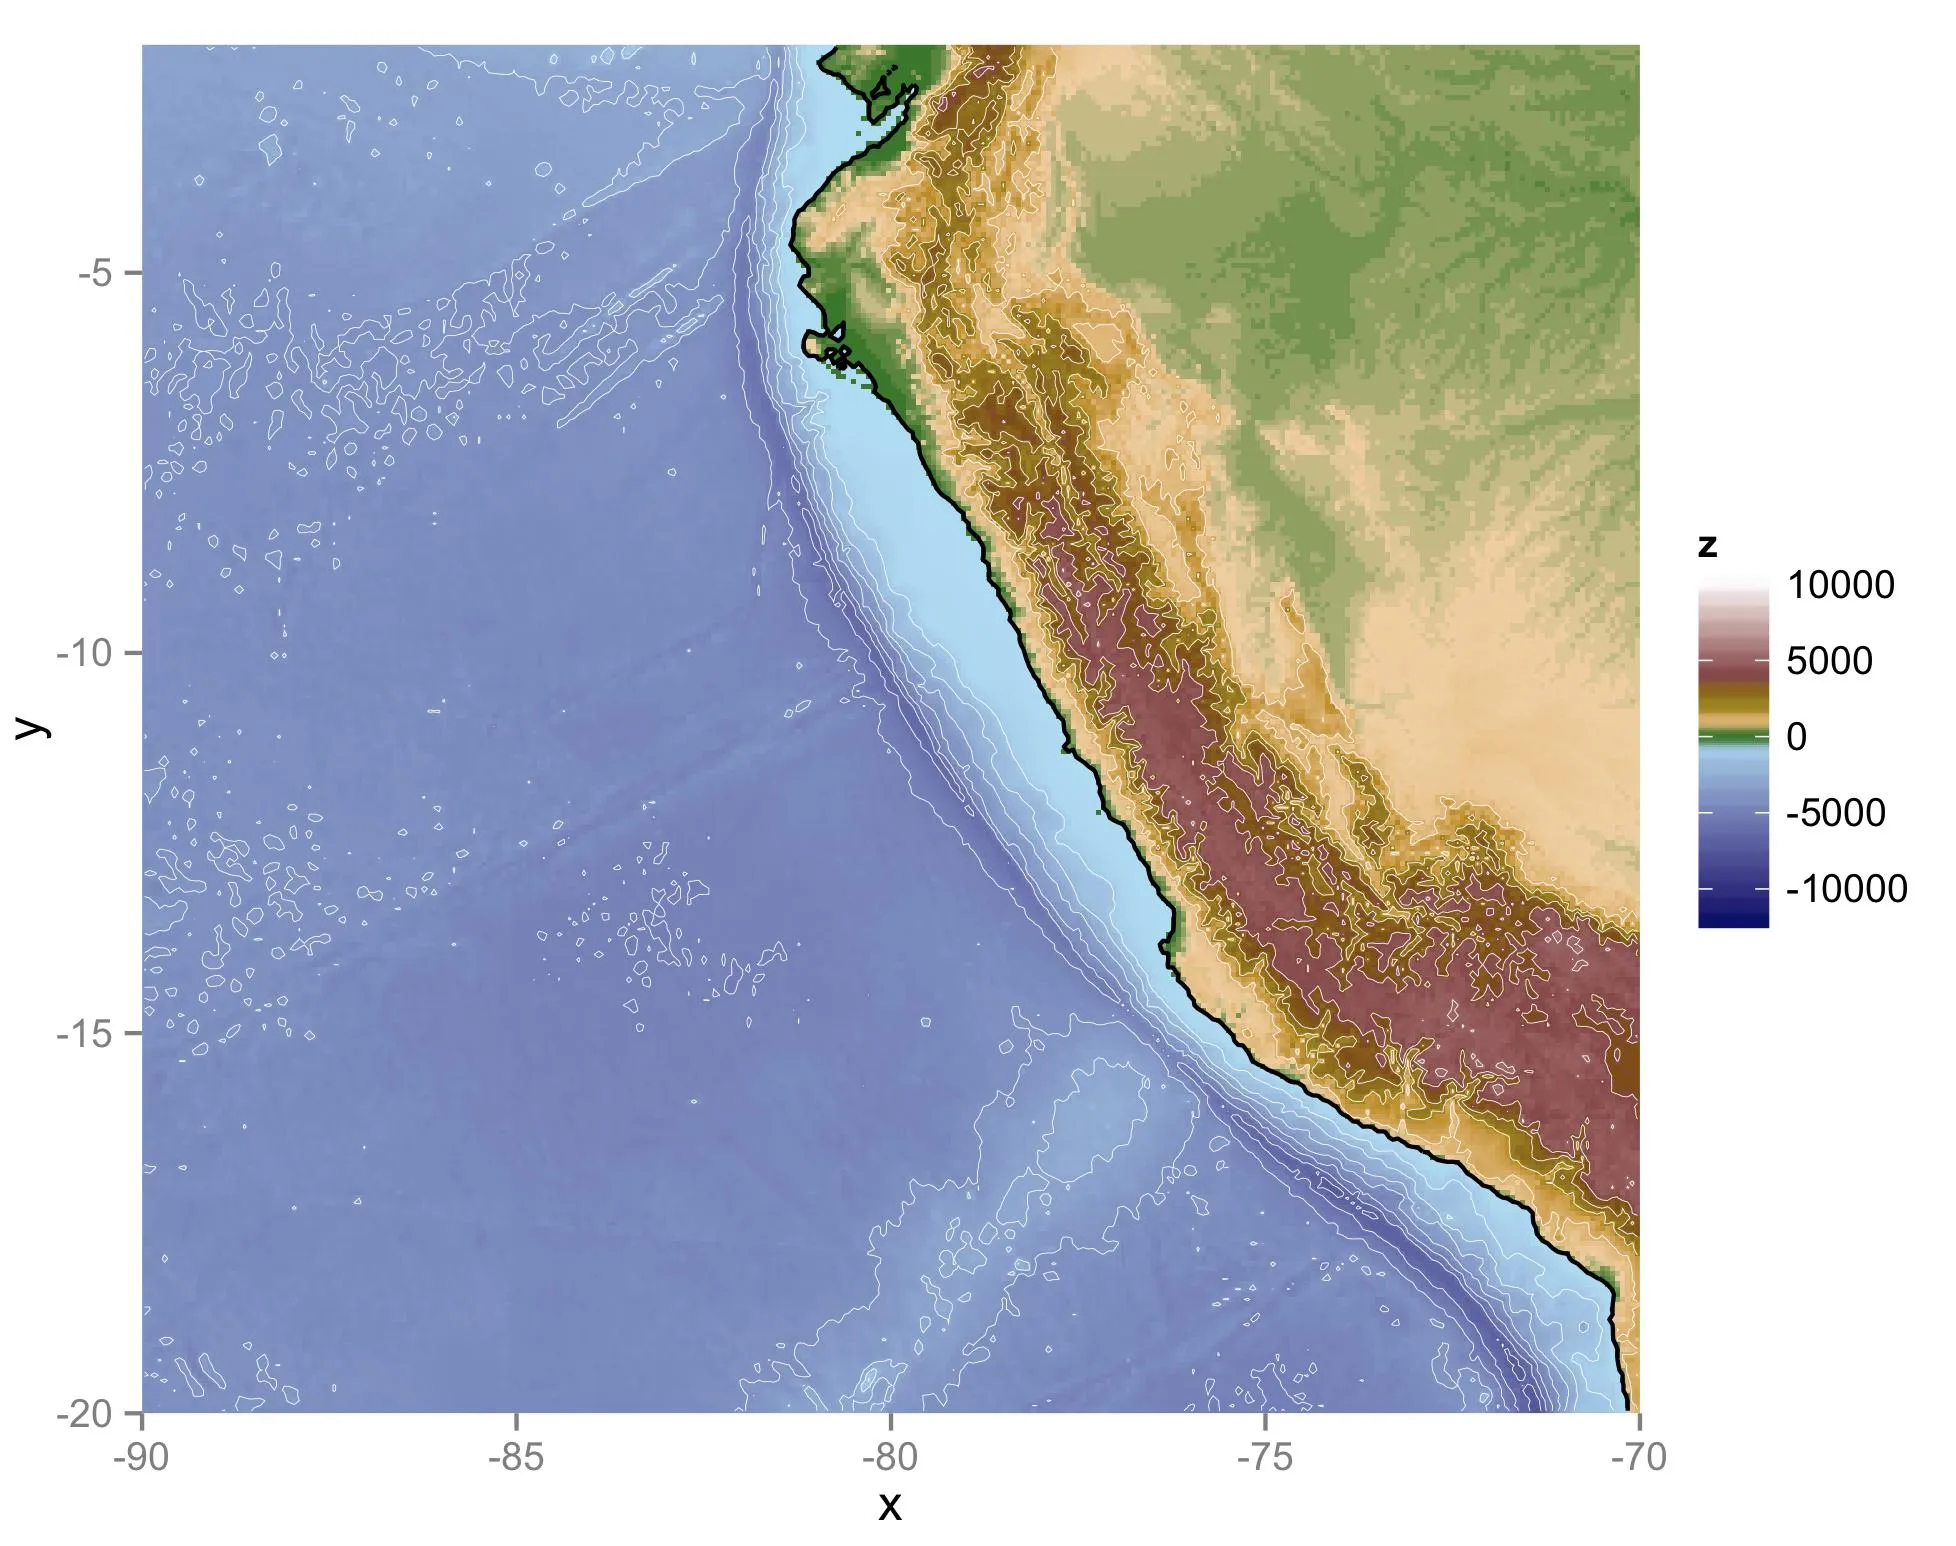
我想要在地图上添加水深线。我正在绘制海岸线附近的点,并且我们对它们距离大陆架有多近很感兴趣。我看过一个叫做 Marmap 的包,但现在我正在使用 ggplot,因为它能提供更高的分辨率。
获取水深线的代码如下:
library(marmap)

Peru.bath <- getNOAA.bathy (lon1 = -90, lon2 = -70, lat1 = -20,
                            lat2 = -2, resolution = 10)

plot(Peru.bath)
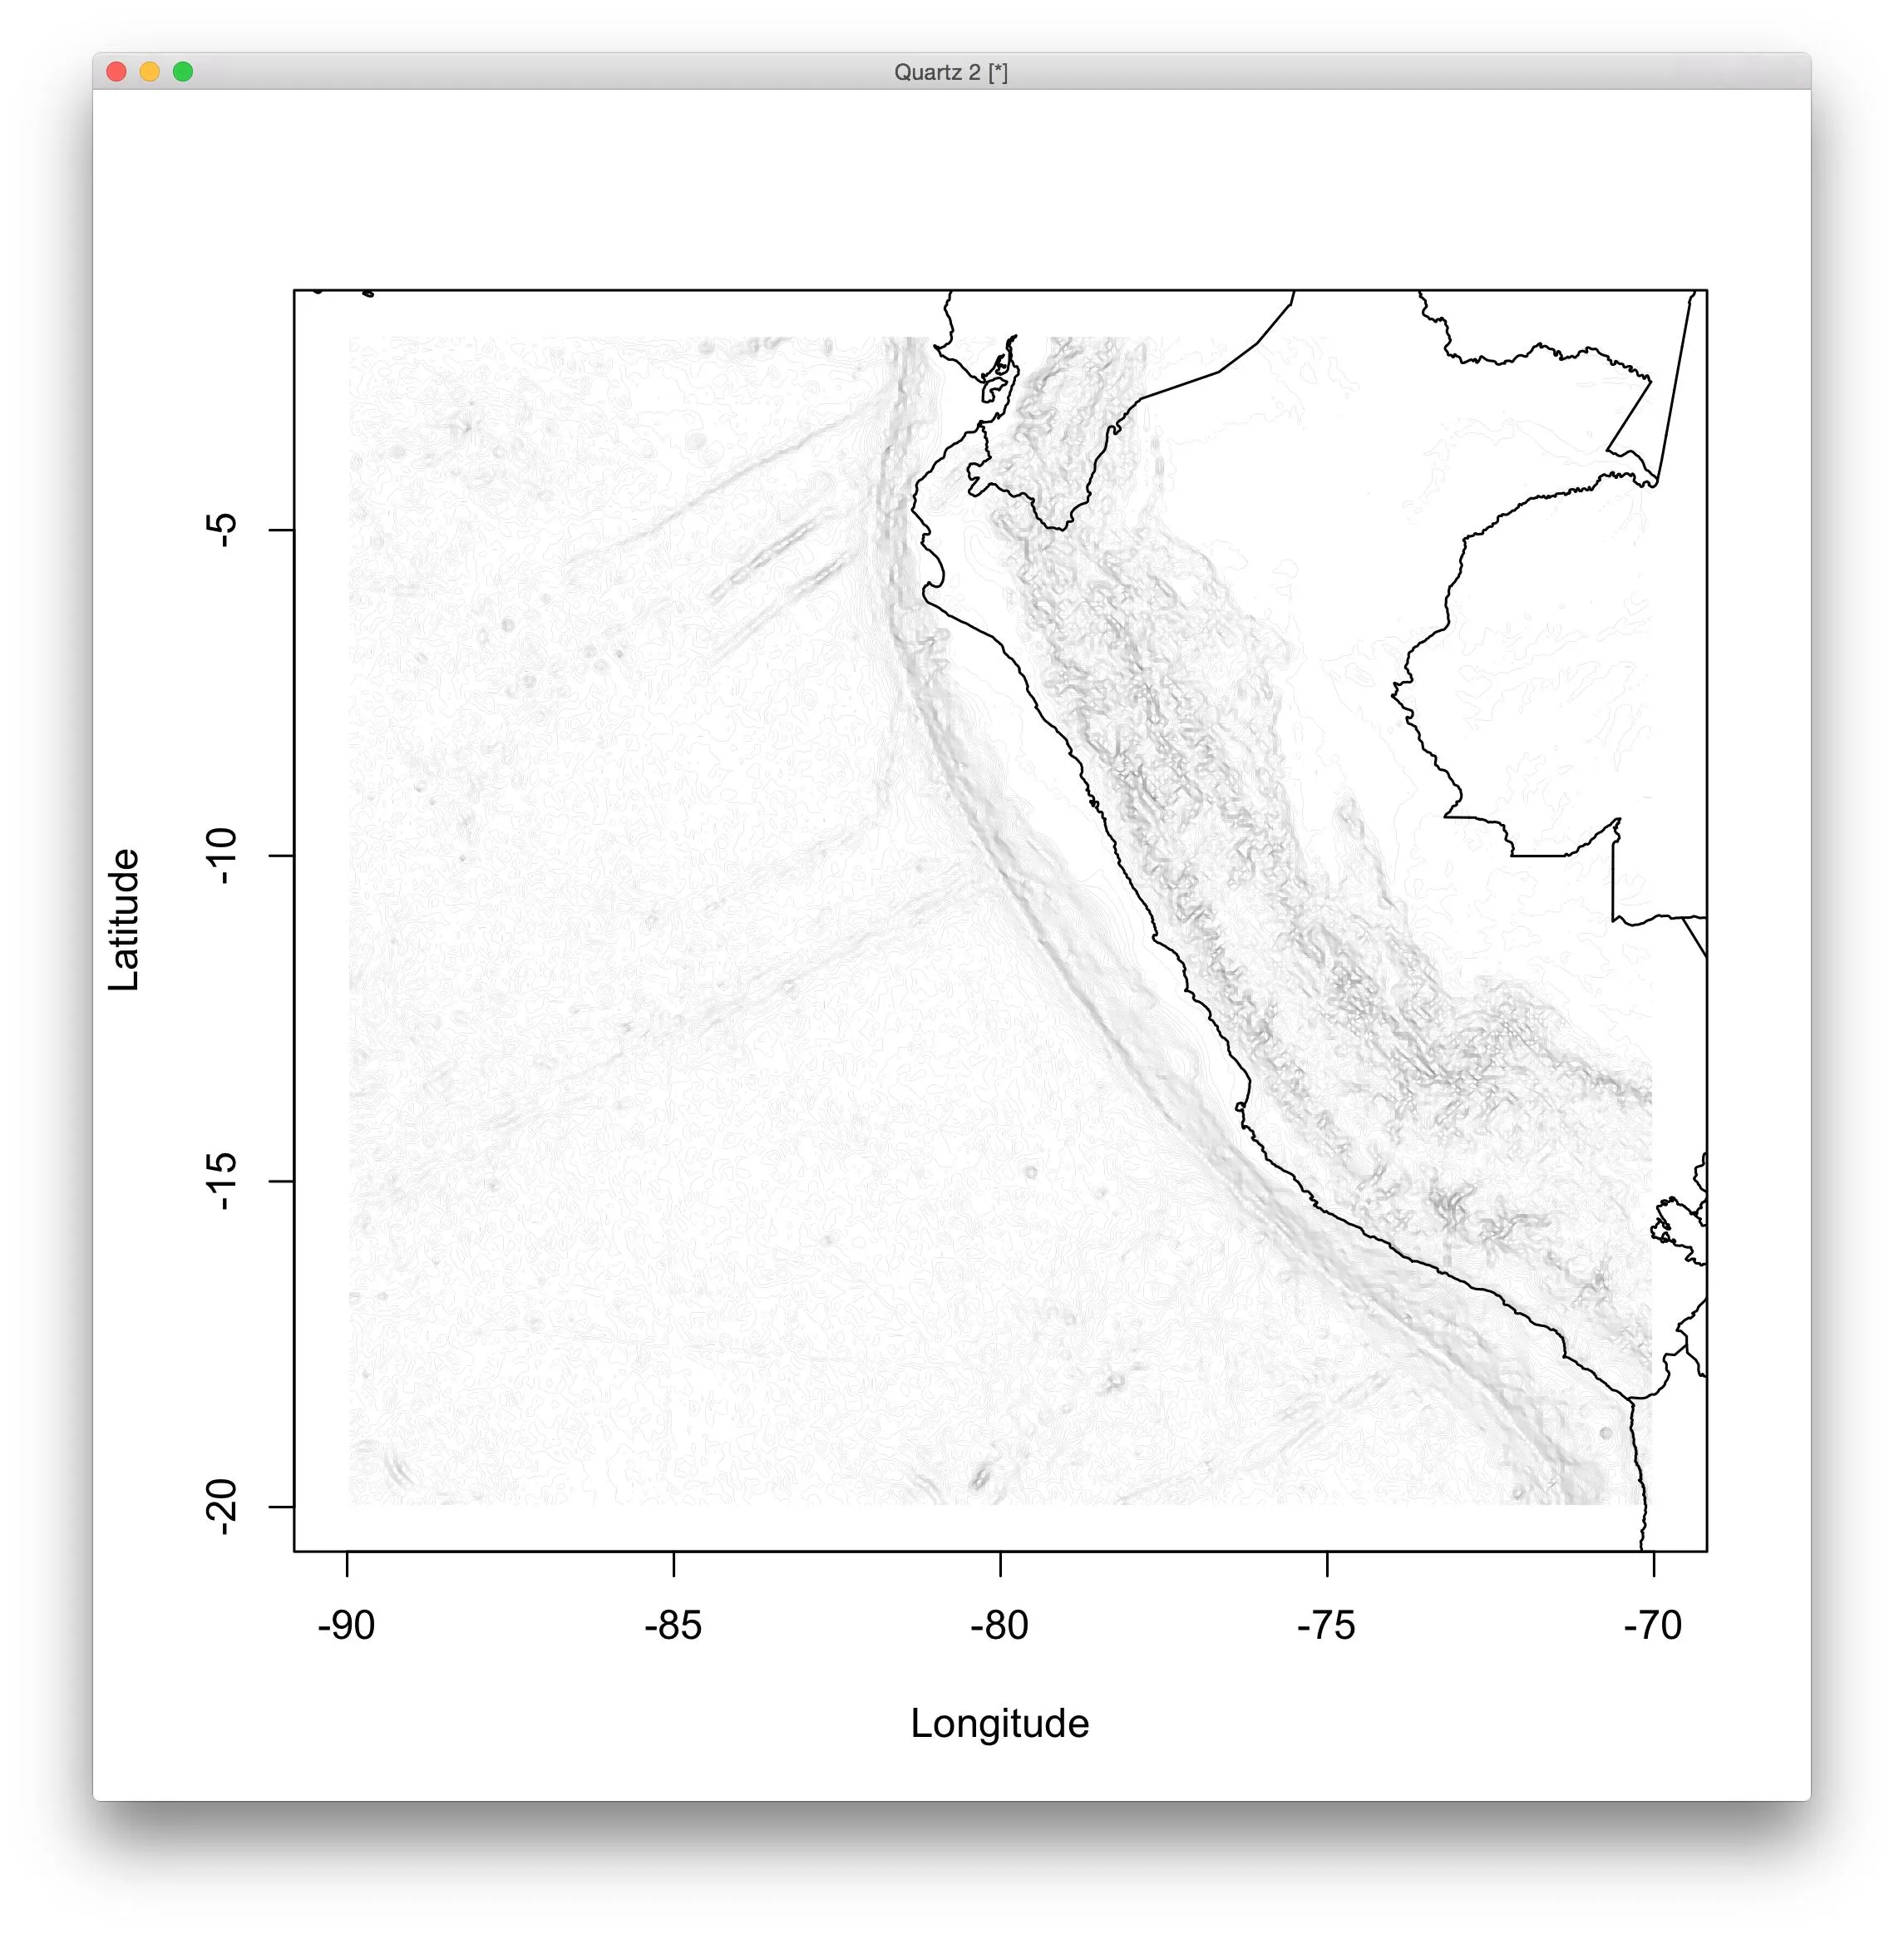
我正在使用的代码如下,我想要添加海底地形线:
coast_map <- fortify(map("worldHires", fill=TRUE, plot=FALSE))
gg <- ggplot()
gg <- gg + geom_map(data=coast_map, map=coast_map,
                    aes(x=long, y=lat, map_id=region),
                    fill="white", color="black") +
  theme(panel.background = element_blank()) +
  theme(panel.grid.major = element_blank()) +
  theme(panel.grid.minor = element_blank()) +
  theme(axis.text.x = element_blank(), axis.text.y = element_blank(), axis.ticks = element_blank())
gg <- gg + xlab("") + ylab("")
gg <- gg + geom_map(data=data.frame(region="Peru"), map=coast_map,
                    aes(map_id=region), fill="gray")
gg <- gg + xlim(-90,-70) + ylim(-20,-2)
gg <- gg + coord_map()
gg
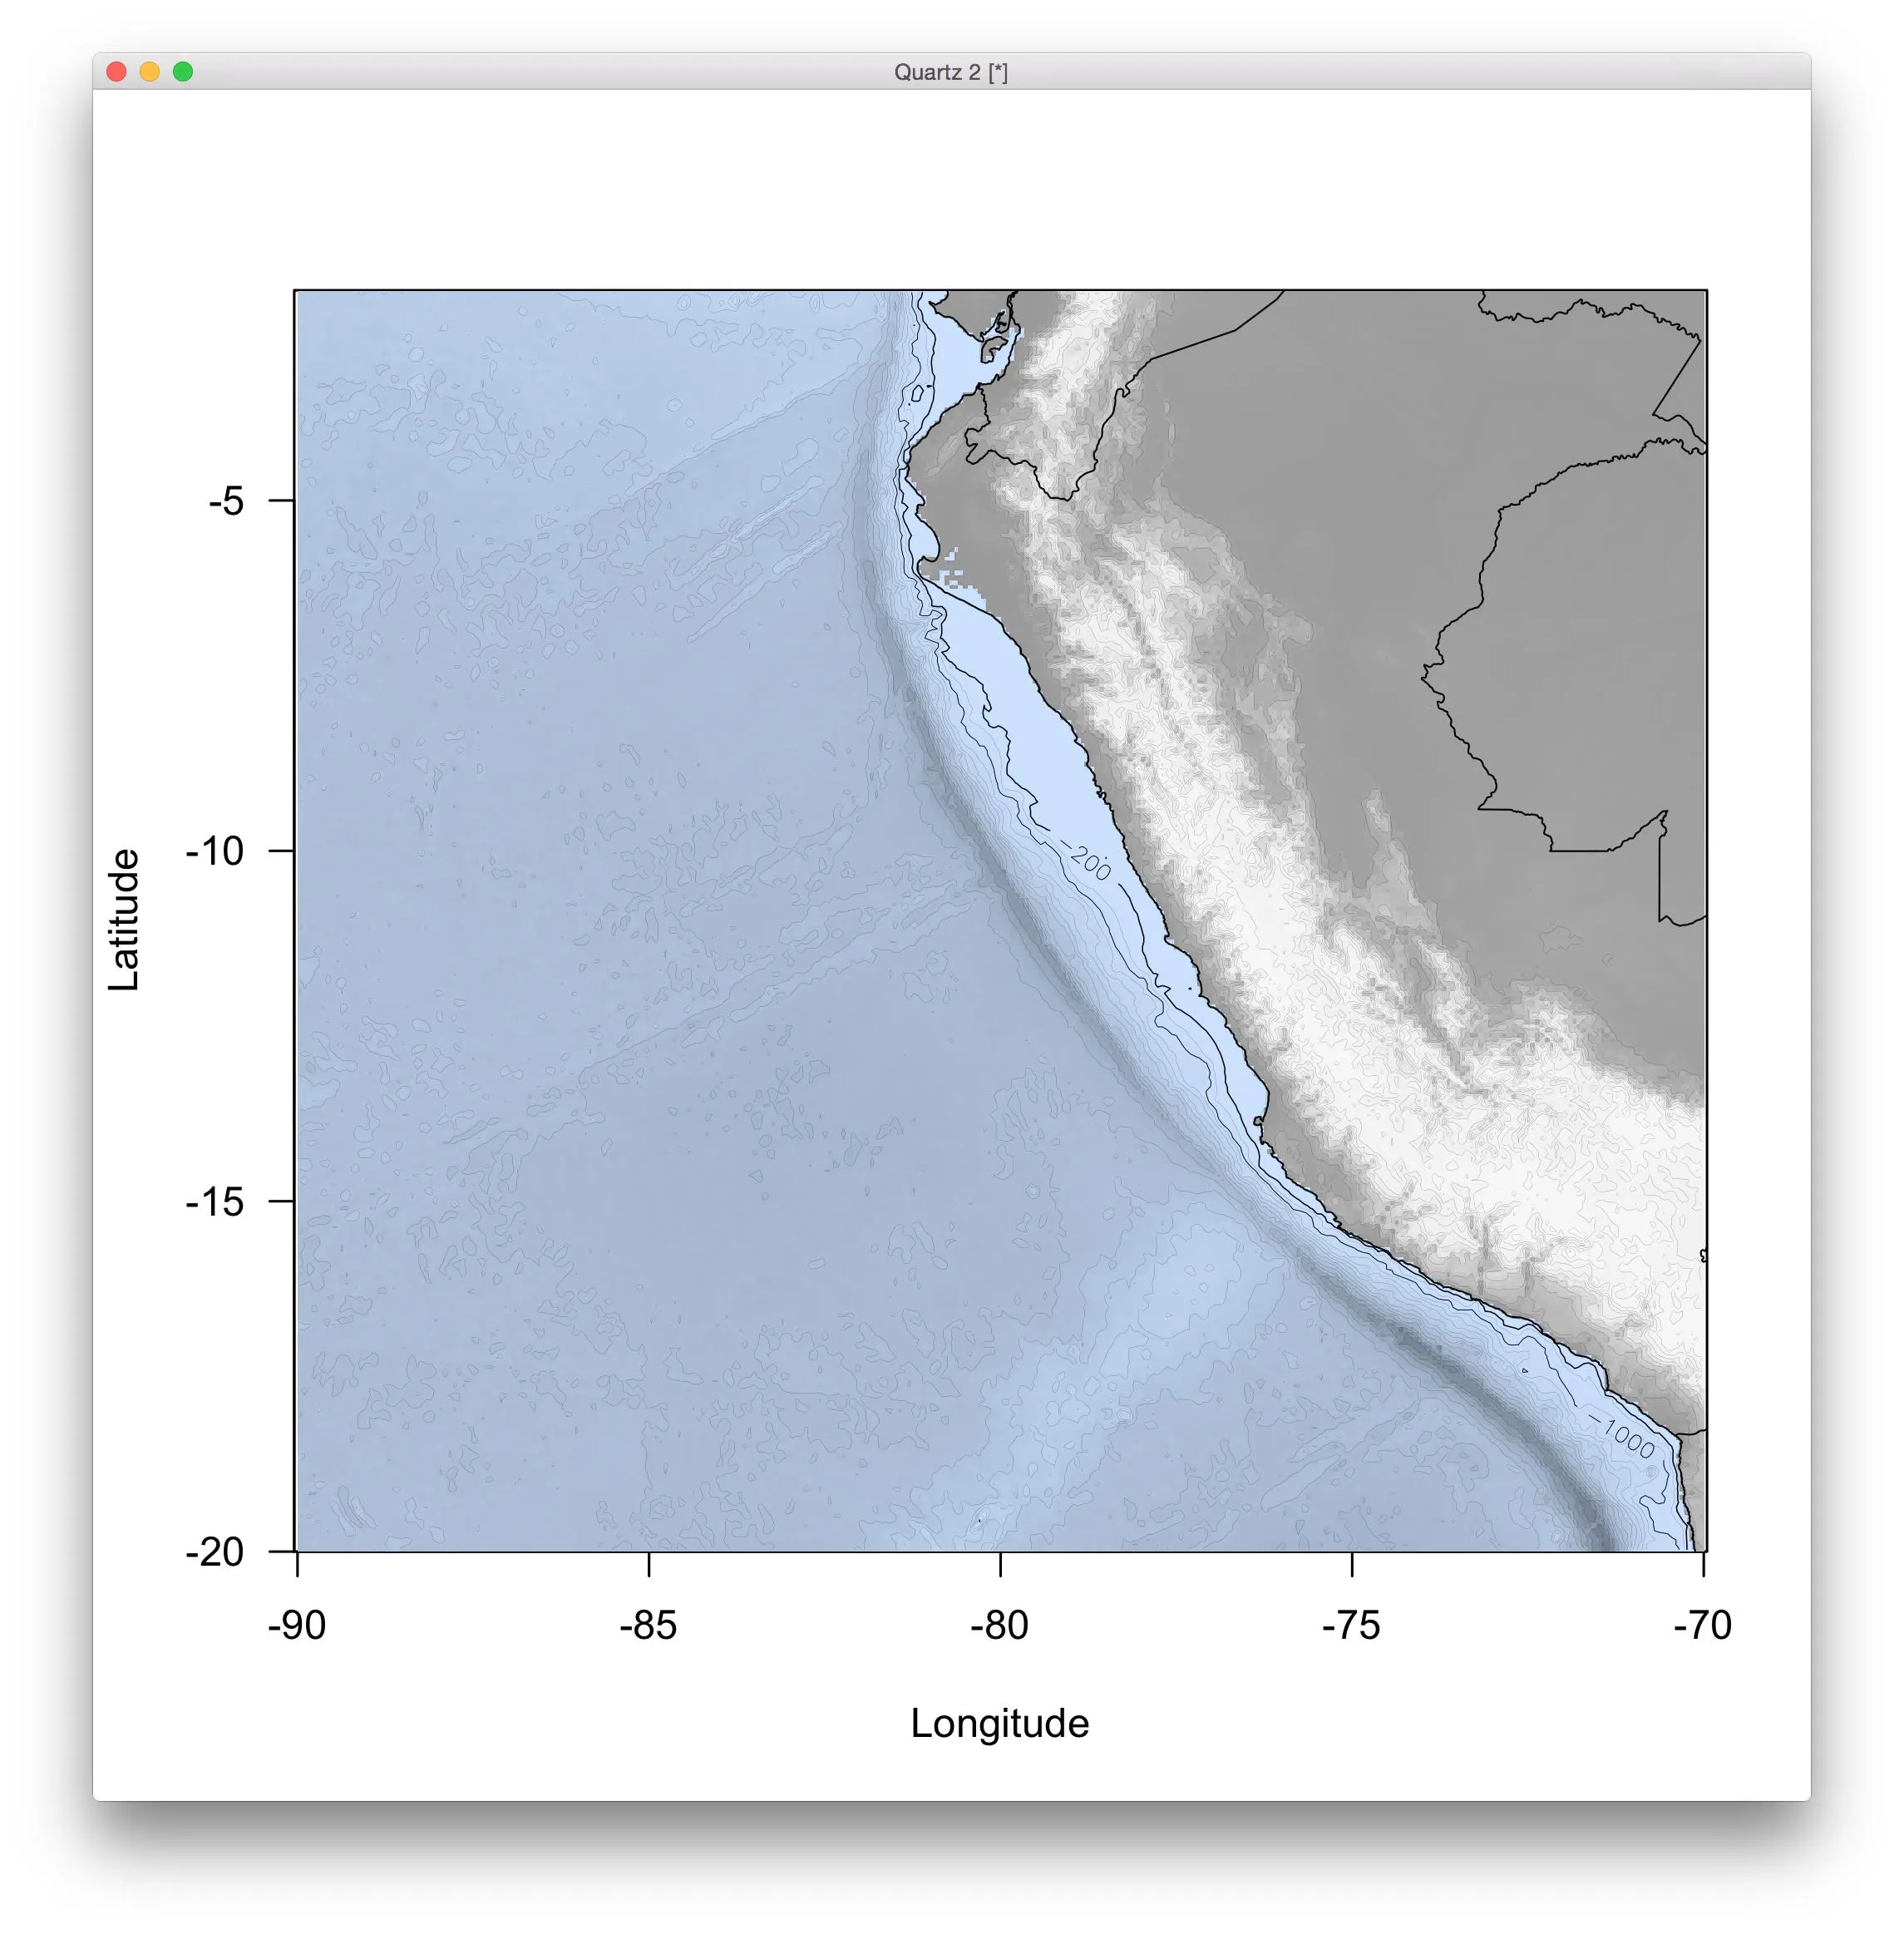
因此,我认为它会是
gg <- gg + Peru.bath
然而,我遇到了“错误:不知道如何将Peru.bath添加到图形中”的问题。
请注意,我没有水深数据,我只是希望在我创建的地图上绘制已知的海洋架线,如果可能的话。