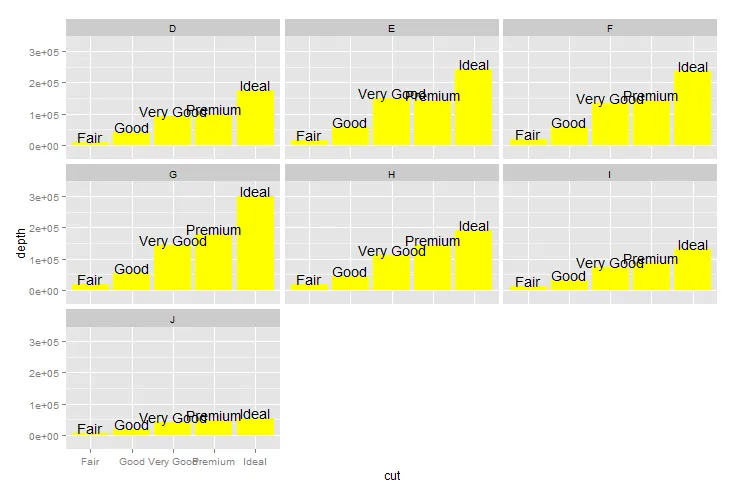
如何调整 y 轴,使得注释在这种类型的图表中也能正常显示?
library(ggplot2)

ggplot(diamonds, aes(x = cut, y = depth)) +
  facet_wrap(~ color) +
  stat_summary(fun.y = sum, geom="bar", fill = "yellow", aes(label=cut, vjust = 0)) +
  stat_summary(fun.y = sum, geom="text", aes(label=cut), vjust = 0)
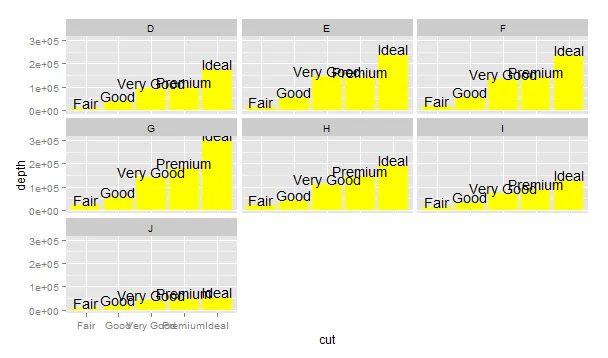
例如,在facet G中,“Ideal”标注未正确显示。Y轴范围应该动态计算,以便在柱形图上方始终有一些空间用于标注。因此,我不能使用固定的y轴范围。