如何在ggplot2中设置y轴标签的宽度

8
我已经用ggplot2制作了一系列直方图,并使用ImageMagick将它们制作成了一个gif动画。 animated gif of graphs made in ggplot2 
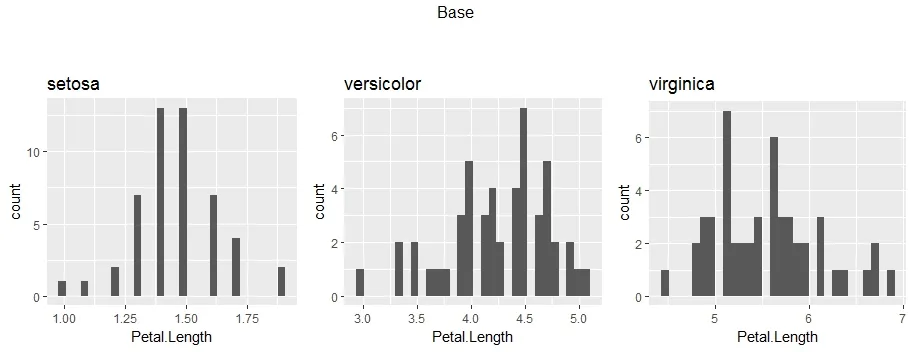
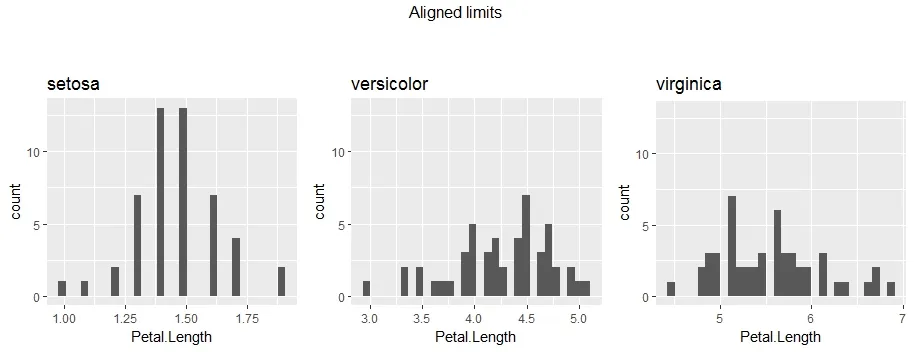
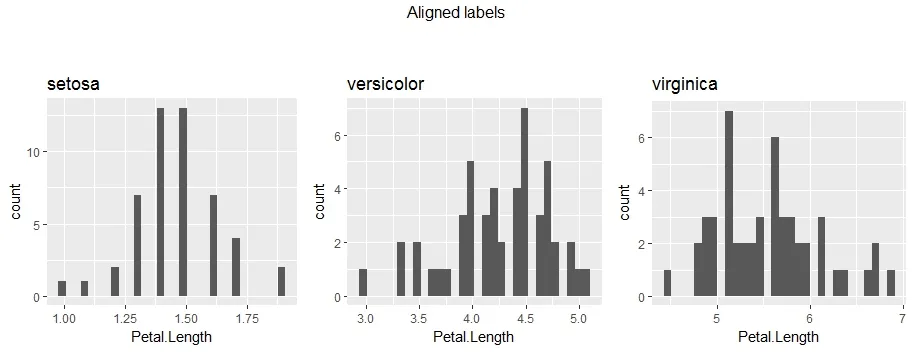
我的想法是所有的图形都应该有相同的x轴刻度,但这并不完全正确,因为由于标签的宽度不同,y轴会摆动。如何使图形固定,以便所有图形具有完全相同的轴位置? 以下是我的ggplot代码,如果有帮助:
hist.fn<-function(tier,ddf){
    df<-ddf[ddf$tier==tier,]
    l<-match(tier,levels(df$tier))
    hist.png<-ggplot(df,aes(df$"Premium Adult Individual Age 40" ))+
    geom_histogram()+   
    labs(title=paste0(tier," premiums in federal exchanges"),
            x ="Premium", y = "Frequency")+
    coord_cartesian(xlim=c(0, 1500))+
        theme_bw()+
        theme(text = element_text(size=14), plot.title = element_text(face="bold"),axis.title.x =element_text(face="bold"),axis.title.y =element_text(face="bold"))
    file=paste0(l,"hist.jpg")

    ggsave(filename=file, plot=hist.png, width=13, height=8, dpi=50)
    return(hist.png)
}
data.df$tier%>% levels %>% lapply(FUN=hist.fn,ddf=data.df) ->histograms.of.tiers    

system("magick -delay 75 *hist.jpg hist.gif")

2
如果您提供一个可重现的示例,包括用于运行和测试代码的样本输入数据,那么帮助您解决问题会更容易。 - MrFlick
4
可能重复:https://dev59.com/tZLea4cB1Zd3GeqP7NBI意思:这个问题可能与另一个问题重复:https://dev59.com/tZLea4cB1Zd3GeqP7NBI。 - MrFlick
3
用空格填充似乎是最好的方法。或者你可以尝试操作“grobs”,但那看起来需要太多工作了。 - Mike H.
除了使用空格填充之外,另一种选择是将标签旋转90º。您还可以通过gganimate和/或magick使其更简单。也许可以查看一些Len Kiefer的代码以获取灵感;他是制作ggplot2 gif的大师。 - alistaire
1
@MrFlick 在我看来,这个问题和链接的重复目标之间存在重大差异。在这里,不同数据集显示了相同的度量(频率),这也需要对齐y轴的比例尺。在链接的问题中,显示了来自一个数据集的不同度量,因此只能通过控制y轴标签的长度来对齐y轴的位置。 - Uwe
2个回答

7

首先,我想指出的是,由于y轴值不同,情节可能会误导。观众的注意力主要会集中在直方图上而不是数值上。 因此,我强烈建议将y轴固定在所有情节中。

library(ggplot2)
library(gridExtra)
library(stringr)

# Generate plots 
# For each Species in iris dataset - generate a histogram of the Petal's length
plots = lapply(levels(iris$Species), 
               function(spec){
                 ggplot(iris[iris$Species == spec, ], aes(Petal.Length)) + 
                   geom_histogram() + 
                   ggtitle(spec)
               })

# Show plots side by side 
grid.arrange(grobs = plots, nrow = 1, ncol = 3, top = "Base\n\n")

base_plots

这是一个关于IT技术的图片。
# Solution 1 (recommended) - Set the same y-axis range for all the plots 
alignLimits = function(plotsList){
  # Extract limits of y-axis for each plot
  y.limits = sapply(plotsList, function(.){layer_scales(.)$y$range$range})
  y.min = min(y.limits[1,]) # Minimum of all the ranges
  y.max = max(y.limits[2,]) # Maximum of all the ranges 

  # Apply new limits for each plot
  return(lapply(plotsList, 
                function(.){. + coord_cartesian(ylim=c(y.min, y.max))}))
}

# Align limits of original plots and display
plots.limits = alignLimits(plots)
grid.arrange(grobs = plots.limits, nrow = 1, ncol = 3, top = "Aligned limits\n\n")

限制

.


然而,如果您选择其他方式,我会使用空格填充轴标签:

# Use whitespaces to pad 
alignLables = function(plotsList){
  # Extract labels of y-axis
  # Note: Don't use the as.character on the maximum limit, 
  #       as decimal places in labels may increase the character count 
  y.labels = lapply(plotsList, function(.){ggplot_build(.)$layout$panel_ranges[[1]]$y.labels}) 

  # Calculate the maximum number of characters for each plot's labels
  maxChars = sapply(y.labels, function(.){max(nchar(.))})

  # Define a function that would space-pad the labels and apply
  format.labels = function(label){str_pad(label, max(maxChars), pad = " ")}
  return(lapply(plotsList, function(.){return(. + scale_y_continuous(labels = format.labels))}))
}

# Align labels of original plots and display
plots.labels = alignLables(plots)
grid.arrange(grobs = plots.labels, nrow = 1, ncol = 3, top = "Aligned labels\n\n")

标签

如有不清楚的地方,请随时提问。


4

将图形转换为gtable后,可以轻松设置固定宽度。请注意,这不是一个稳定的接口,因此将来可能会停止工作。

library(ggplot2)
library(grid)
library(gridExtra)

plot_random <- function(){
  ggplot() +
    labs(y=paste(letters[sample(1:24, sample(1:3))], collapse = "\n"))
}

pl <- replicate(3, plot_random(), simplify = FALSE)
gl <- lapply(pl, ggplotGrob)
wl <- lapply(gl, function(g) g$widths[4])
wmax <- do.call(unit.pmax, wl)
gl <- lapply(gl, function(g) {g$widths[4] <- wmax; g})

grid.arrange(arrangeGrob(grobs = pl, top = "Normal case"),
             arrangeGrob(grobs = gl, top = "Standardised left"))

非常好的答案,谢谢!现在是 g$widths[4],但这个接口不稳定! - gdkrmr

网页内容由stack overflow 提供, 点击上面的
可以查看英文原文,
原文链接