我有两个数组:
例如:
a=[1, 2, 3, 4]

b=[10, 20, 30, 40]
我需要绘制直方图,我知道使用像(1,10),(2,20)这样的坐标很容易绘制曲线。但是如何从数组中绘制直方图呢?目前我卡在了绘制直方图的选项上。有什么建议吗?
import matplotlib.pyplot as plt
import numpy as np

a = [([97, 99, 99, 96, 97, 98, 99, 97, 99, 99, 96, 97, 99, 99, 95,
       98, 99, 97, 97, 98, 97, 96, 98, 98, 98, 98, 98, 98, 96, 98, 98, 98, 98,
       98, 98, 96, 97, 97, 97, 97, 97, 96, 96, 97, 97, 96, 95, 97, 96, 97, 96, 97,
       96, 95, 96, 97, 95, 95, 93, 93, 92, 93, 93, 95, 95, 94, 93, 94, 94, 95, 95, 95,
       95, 96, 96, 95, 96, 96, 96, 96, 94, 95, 90, 95, 95, 95, 95,
       95, 88, 94, 94, 93, 95, 95, 94, 95, 95, 95, 95, 95, 93],)]

for item in a[0]:
    s = item

lengths = len(s)
s2 = [s[x:x+9] for x in xrange(0, len(s), 9)]
print s2.index(min(s2))

test = 2400+int(lengths)
xaxis=range(2400,test)
yaxis=s
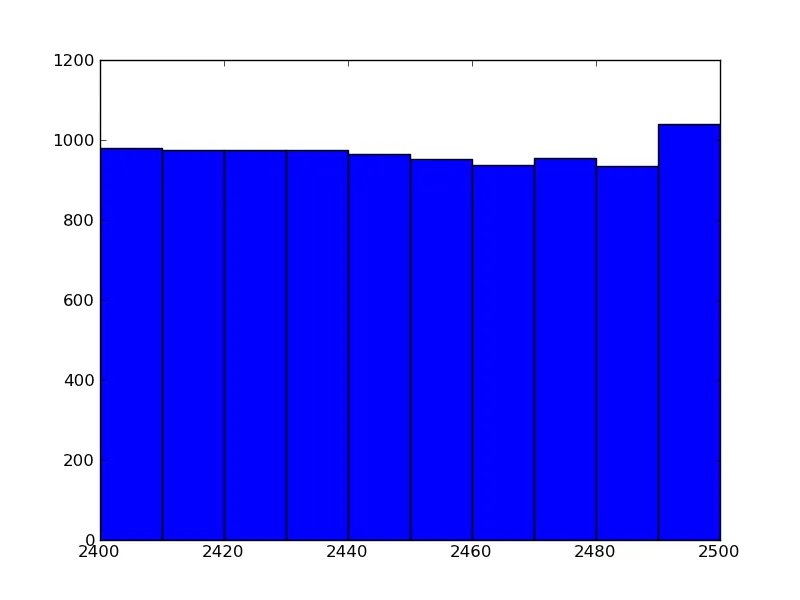
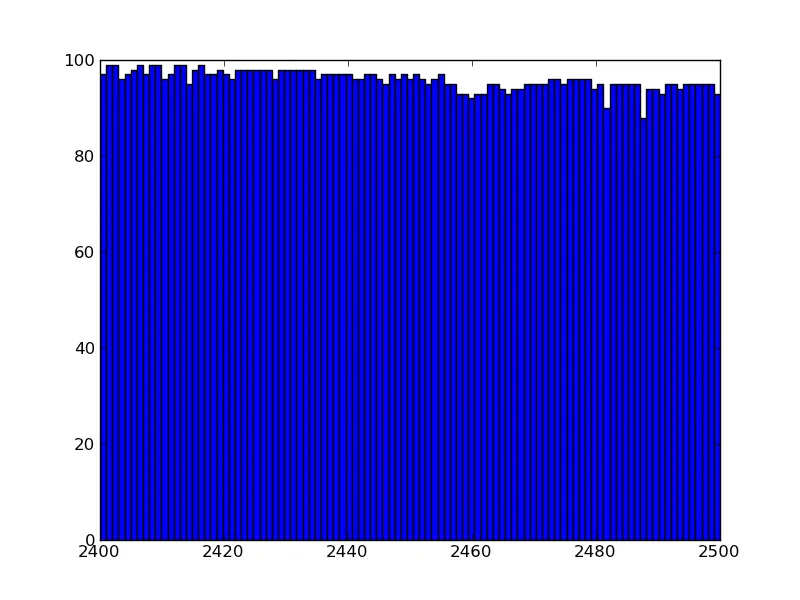
以下是图像示例,其中x轴的值为2400-2500,y轴的值来自某种数组。