将曲线拟合到常微分方程

3

我希望对以下ODE拟合一条曲线:

dA/dt = k1*profit + k2

我有变量Aprofit的观测时间序列,并希望使用Python中的曲线拟合技术获取k1k2的最优值。我可以编写下面的代码进行操作,但是解决方案拟合效果不好,或者我的方法可能有误。

import numpy as np
from scipy.optimize import curve_fit
from scipy.integrate import odeint

def fitfunc(t, k1, k2):
    'Function that returns A computed from an ODE for k1 and k2'
    def myode(area, t):
        profit = get_profit(t)
        return k1*profit + k2

    A0 = 200000    #initial value of A
    out = odeint(myode, A0, t)
    return out[:,0]

k_fit, kcov = curve_fit(fitfunc, time_span, obs_A)  #time span from 1999-2019 and obs_A is the observed values of A

modeled_A = fitfunc(time_span, k_fit[0], k_fit[1])

这20年期间的利润和obs_A数据如下:

profit = [ 7.65976374e+06, -6.13172279e+06,  1.03946093e+07,  2.59937877e+06,
       -7.88358386e+06, -1.38918115e+04, -3.13403157e+06, -4.74348806e+06,
        1.87296164e+07,  4.13680709e+07, -1.77191198e+07,  2.39249499e+06,
        1.38521564e+07,  6.52548348e+07, -5.78102494e+07, -5.72469988e+07,
       -5.99056006e+06, -1.72424523e+07,  1.78509987e+07,  9.27860105e+06,
       -9.96709853e+06]

obs_A = [200000., 165000., 150000., 180000., 190000., 195000., 200000.,
       165000., 280000., 235000., 250000., 250000., 250000., 295000.,
       295000., 285000., 245000., 315000., 235000., 245000., 305000.]

time_span = np.arange(1999,2020)

这里的get_profit是一个函数,它会在给定的t时刻输出利润值。该函数是通过以下方式对观测到的profit数据进行插值创建的:

profit_fun = interp1d(t, profit.values, 1, fill_value="extrapolate")

def get_profit(t):
    return profit_fin(t)

我不确定如何在这里使用profit变量,因为它会在每个时间步骤发生变化。我的方法正确吗?


你能提供你试图拟合的数据,或者至少一些可以重现你行为的玩具数据吗? - K.Cl
@K.Cl,已添加利润和观察区域的数据。 - lsr729
我通过为k1和k2提供1E-2和1E4的初始值,使模型的大小更接近于数据,但曲线的形状(看起来像两个相连的峰)几乎不受我选择的任何参数的影响。这似乎是模型中的问题,因此我删除了
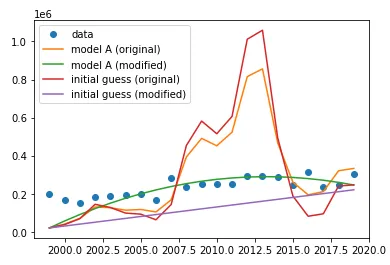
t的插值(我不知道它有什么用处,但我不懂ODEs),结果可能会好一些,但看起来像是平滑曲线。从这里开始,我不知道该怎么做,抱歉。 - K.Cl
@K.Cl,您能否在答案中发布您的代码?您是否删除了插值或利润? - lsr729
好的,我已经发布了,但我不知道它是否回答了你的问题。希望它能帮助指导你。 - K.Cl
1个回答

1
(按要求翻译如下):

(根据要求,这里是代码)

首先,设置一些东西。只添加了 fitfun2,它修改了 fitfunc 并删除了对 get_profit 的调用(因此不会对数据进行插值)。

import numpy as np
from scipy.optimize import curve_fit
from scipy.integrate import odeint
from scipy.interpolate import interp1d
import matplotlib.pyplot as plt

def fitfunc(t, k1, k2):  # Original
    'Function that returns A computed from an ODE for k1 and k2'
    def myode(area, t):
        profit = get_profit(t)
        return k1*profit + k2

    A0 = 20000    #initial value of A
    out = odeint(myode, A0, t)
    return out[:,0]

def fitfunc2(t, k1, k2): # Modified
    'Modified fitfunc, removing the call to `profit_fun`'
    def myode(area, t):
        return k1*t+k2

    A0 = 20000    #initial value of A
    out = odeint(myode, A0, t)
    return out[:,0]

profit = np.array([ 7.65976374e+06, -6.13172279e+06,  1.03946093e+07,  2.59937877e+06,
       -7.88358386e+06, -1.38918115e+04, -3.13403157e+06, -4.74348806e+06,
        1.87296164e+07,  4.13680709e+07, -1.77191198e+07,  2.39249499e+06,
        1.38521564e+07,  6.52548348e+07, -5.78102494e+07, -5.72469988e+07,
       -5.99056006e+06, -1.72424523e+07,  1.78509987e+07,  9.27860105e+06,
       -9.96709853e+06])

obs_A = np.array([200000., 165000., 150000., 180000., 190000., 195000., 200000.,
       165000., 280000., 235000., 250000., 250000., 250000., 295000.,
       295000., 285000., 245000., 315000., 235000., 245000., 305000.])

time_span = np.arange(1999,2020)

profit_fun = interp1d(time_span, profit, 1, fill_value="extrapolate")

def get_profit(t):
    return profit_fun(t)

现在,适配并绘制结果。
p0 = (1E-2, 1E4)
k_fit, kcov = curve_fit(fitfunc, time_span, obs_A, p0=p0)
k_fit2, kcov2 = curve_fit(fitfunc2, time_span, obs_A, p0=p0)

modeled_A = fitfunc(time_span, *k_fit)
guess_A = fitfunc(time_span, *p0)

modeled_A2 = fitfunc2(time_span, *k_fit2)
guess_A2 = fitfunc2(time_span, *p0)

plt.plot(time_span, obs_A, marker='o', lw=0, label='data')
plt.plot(time_span, modeled_A, label='model A (original)')
plt.plot(time_span, modeled_A2, label='model A (modified)')
plt.plot(time_span, guess_A, label='initial guess (original)')
plt.plot(time_span, guess_A2, label='initial guess (modified)')

plt.legend()

这是图表:enter image description here 正如我所提到的,修改参数k不会影响原始模型曲线的形状。它仍然看起来有点“阶梯式”。如果删除对get_profit的调用,则曲线变得更加平滑,但我不知道 @Isr729 是否期望这样。

1
谢谢,虽然它没有回答我的问题,但还是有帮助的。 - lsr729

网页内容由stack overflow 提供, 点击上面的
可以查看英文原文,
原文链接