在R语言的ggplot中,将总直方图计数添加到分面中。

3
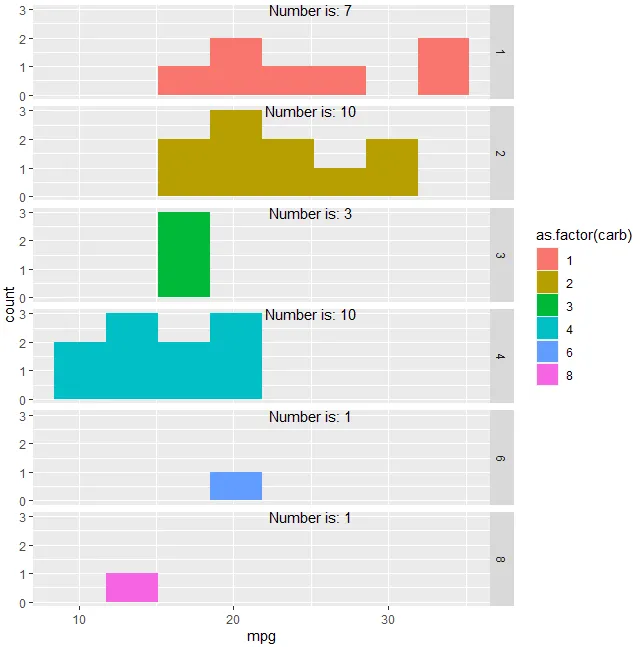
我想制作一个多面直方图,并在每个图上添加文本,指示该面板中观测值的总数。因此,对于 carb = 1,总计数将为 7;carb = 2,总计数将为 10 等等。
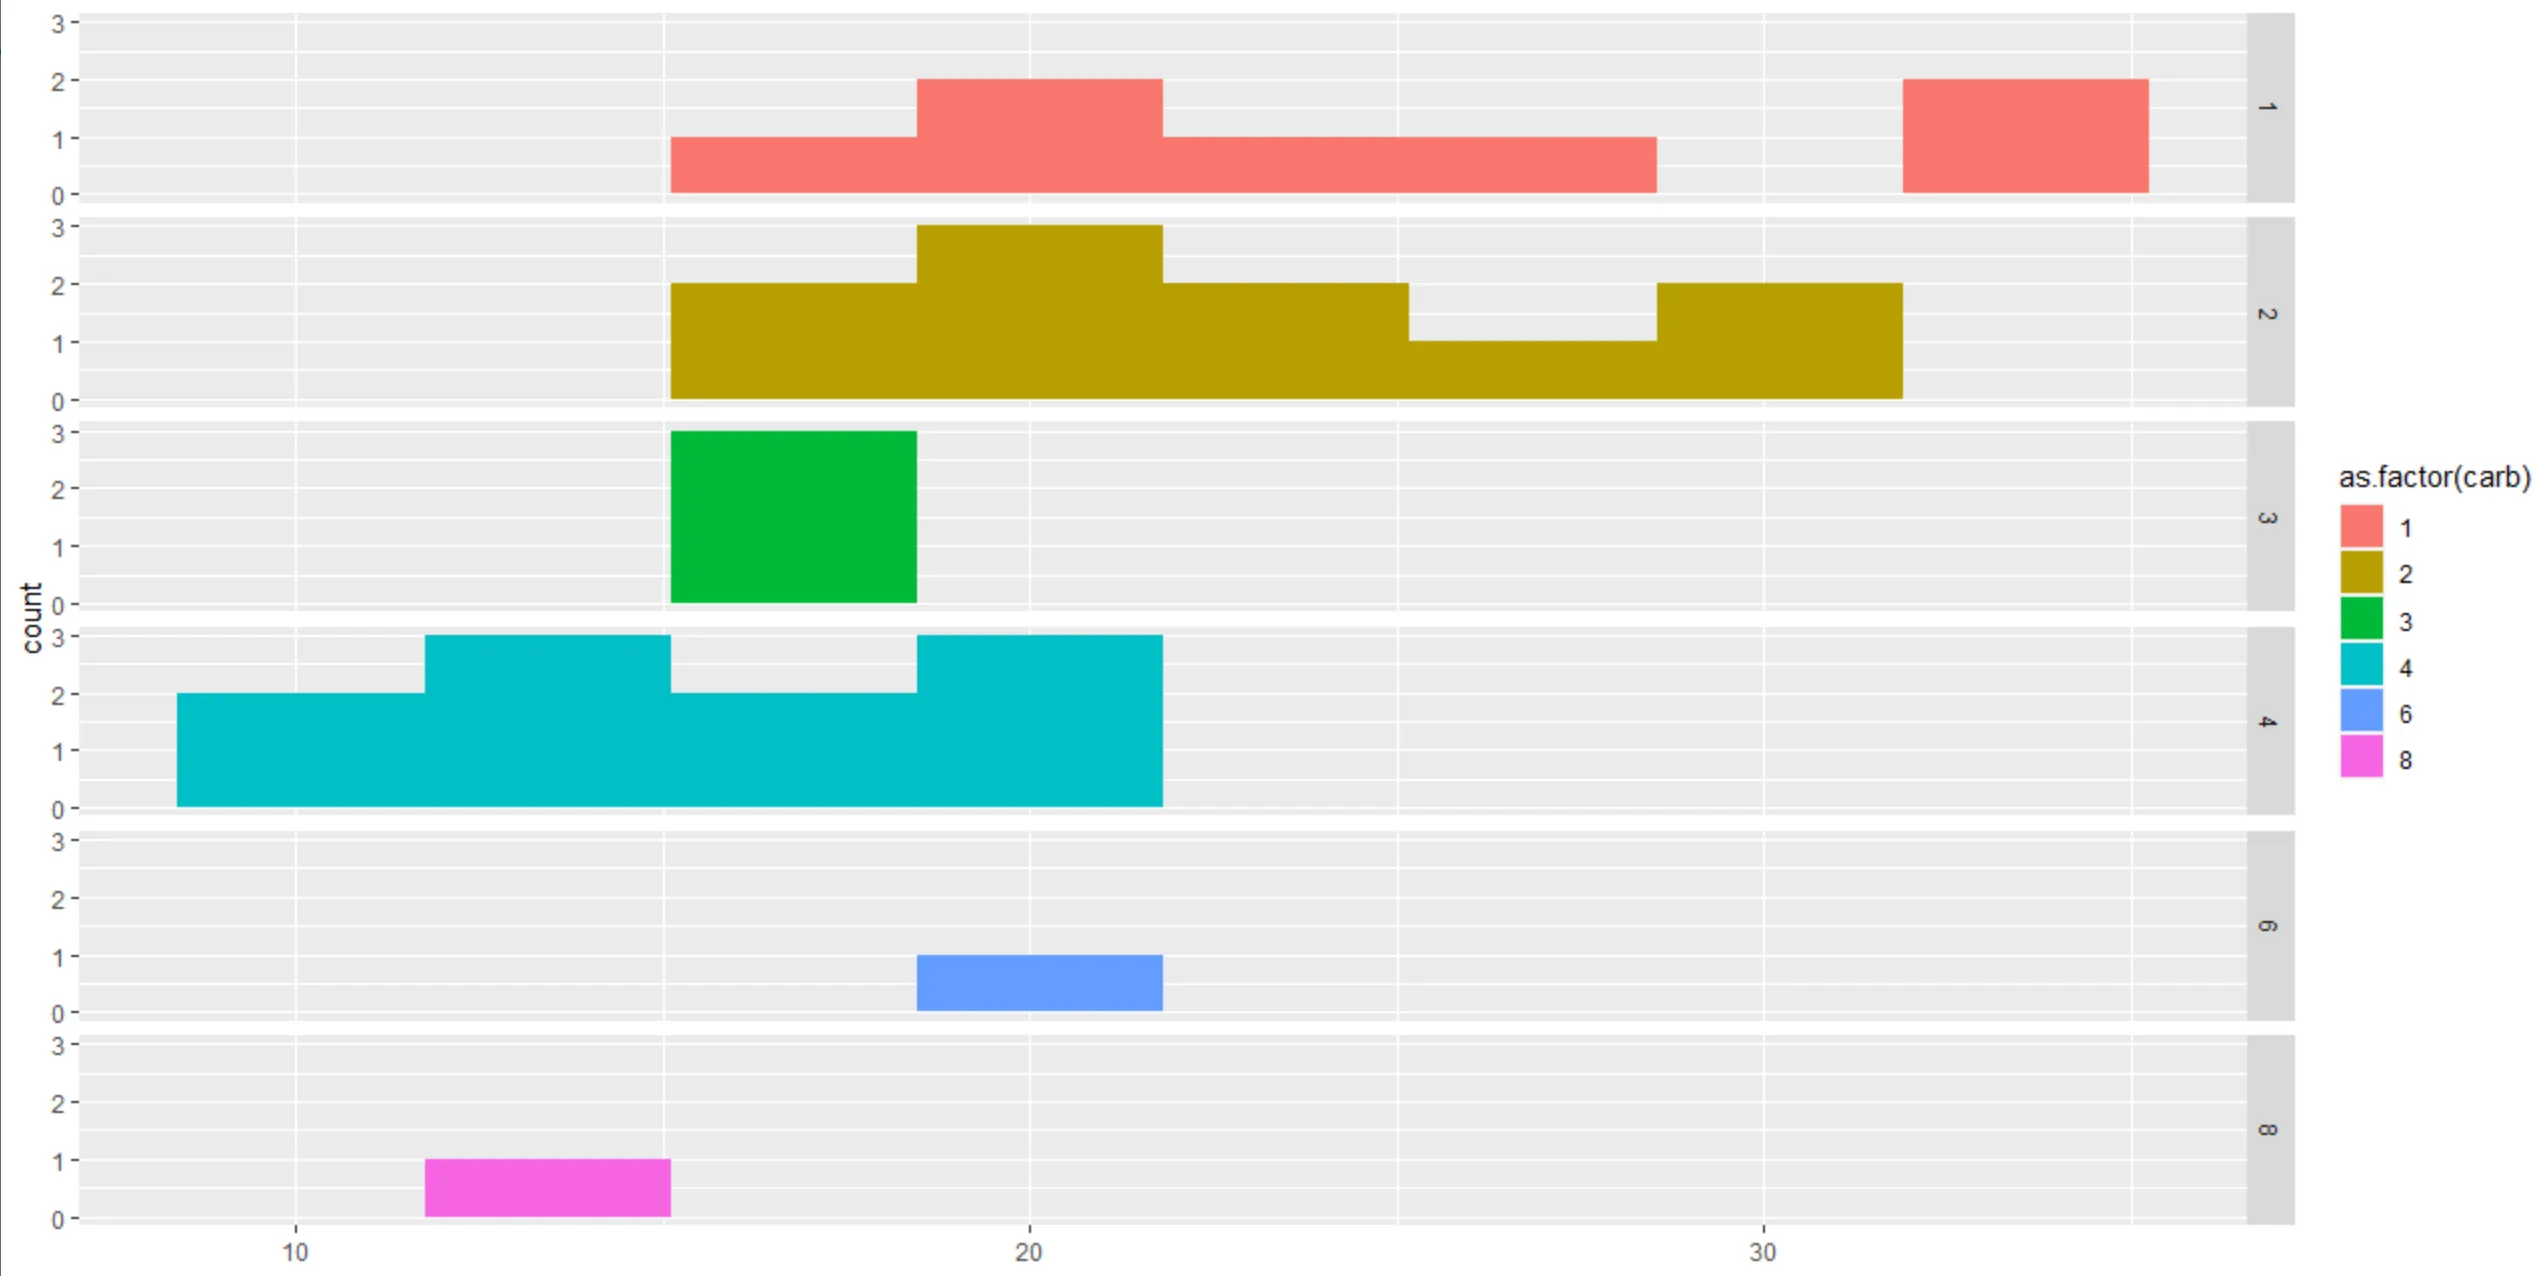
p <- ggplot(mtcars, aes(x = mpg, stat = "count",fill=as.factor(carb))) + geom_histogram(bins = 8)
p <- p + facet_grid(as.factor(carb) ~ .)
p

我可以使用表格函数来完成这个任务,但对于更复杂的分面,我该如何快速完成?

enter image description here

1个回答

3
你可以尝试这样做。也许不是最优解,因为你需要为标签定义 xy 的位置(在 Labels 中定义 x, 在 geom_text() 中定义 y,数字为 3)。但它可能会对你有所帮助:
#Other
library(tidyverse)
#Create similar data for labels
Labels <- mtcars %>% group_by(carb) %>% summarise(N=paste0('Number is: ',n()))
#X position
Labels$mpg <- 25
#Plot
ggplot(mtcars, aes(x = mpg, stat = "count",fill=as.factor(carb))) + geom_histogram(bins = 8)+
  geom_text(data = Labels,aes(x=mpg,y=3,label=N))+facet_grid(as.factor(carb) ~ .)

enter image description here


网页内容由stack overflow 提供, 点击上面的
可以查看英文原文,
原文链接