我想绘制一个包含以下两列数据的pandas数据框:
For i in data1:
  for j in data2:
      traces.append(
           go.Scatter(
                 x=df['A'],
                  y=df['B']
               )
           )
绘图
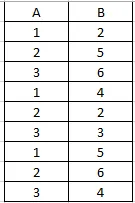
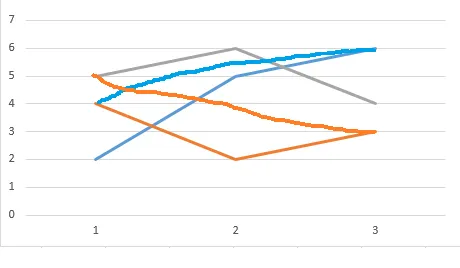
列A有重复值。当我绘制它们时,它正确地绘制了第一个点(列'A'1,2,3列'B'2,5,6),但是当它开始绘制第二组重复值 'A' 1,2,3 'B' 4,2,3时,它从'B'点6画一条线到下一个'B'点2。 它不会像下面显示的那样重新开始。
从这个:
到这个: