我想在使用
我阅读了
下面是一个reprex,请问是否可以提供建议?
ggplot()生成的图表上添加次要轴刻度线和/或标记。这似乎是一个简单的任务,但却很具有挑战性。我找到了这个解决方案,但它相对不太优雅,并且不适合我的应用程序。我将使用不同的数据多次重新绘制我的图形,因此会更改轴限并破坏通过geom_vline()进行的任何手动规格说明。我阅读了
scales::minor_breaks_width()的文档,并尝试将其用于scale_x_continuous()的minor_breaks参数,但它会引发有关"循环遍历中断"的错误。下面是一个reprex,请问是否可以提供建议?
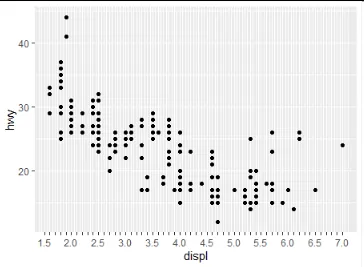
library(tidyverse)

p <- mpg %>%
  ggplot(aes(displ, hwy))+
  geom_point()

# major breaks are easy to set
p +
  scale_x_continuous(
    breaks = scales::breaks_width(width = 0.5, offset = 0))

# adding a minor breaks specification throws an error
p +
  scale_x_continuous(
    breaks = scales::breaks_width(width = 0.5, offset = 0),
    minor_breaks = scales::minor_breaks_width(width = 0.01, offset = 0) )
#> Error in loop_breaks(range, breaks, f): argument "breaks" is missing, with no default

本示例由 reprex(v0.3.0)软件包于2020年11月19日创建