我正在寻找与高斯拉普拉斯边缘检测等效的实现方法。
在Matlab中,我们使用以下函数:
[BW,threshold] = edge(I,'log',...)
Python中存在一个用于计算高斯拉普拉斯的函数,但它并不能确定地返回边缘。
scipy.ndimage.filters.gaussian_laplace
谢谢
我正在寻找与高斯拉普拉斯边缘检测等效的实现方法。
在Matlab中,我们使用以下函数:
[BW,threshold] = edge(I,'log',...)
Python中存在一个用于计算高斯拉普拉斯的函数,但它并不能确定地返回边缘。
scipy.ndimage.filters.gaussian_laplace
matlab的edge()函数应该执行以下操作:
scipy的LoG滤波器仅执行上述第1步。我实现了以下代码来模拟第2~4步:
import scipy as sp
import numpy as np
import scipy.ndimage as nd
import matplotlib.pyplot as plt
from skimage import data

# lena = sp.misc.lena() this function was deprecated in version 0.17
img = data.camera()  # use a standard image from skimage instead
LoG = nd.gaussian_laplace(img , 2)
thres = np.absolute(LoG).mean() * 0.75
output = sp.zeros(LoG.shape)
w = output.shape[1]
h = output.shape[0]

for y in range(1, h - 1):
    for x in range(1, w - 1):
        patch = LoG[y-1:y+2, x-1:x+2]
        p = LoG[y, x]
        maxP = patch.max()
        minP = patch.min()
        if (p > 0):
            zeroCross = True if minP < 0 else False
        else:
            zeroCross = True if maxP > 0 else False
        if ((maxP - minP) > thres) and zeroCross:
            output[y, x] = 1

plt.imshow(output)
plt.show()
当然,这个方法很慢,而且可能不是最符合Python习惯的,因为我也是Python新手,但这应该能说明思路。欢迎提出任何改进建议。
我稍微尝试了ycyeh的代码(感谢提供),在我的应用中,使用与最小-最大范围成比例的输出值比仅使用二进制0和1得到了更好的结果。(然后我也不再需要阈值,但可以轻松地在结果上应用阈值处理。)此外,我将循环改为numpy数组操作以加快执行速度。
import numpy as np
import scipy.misc
import cv2  # using opencv as I am not too familiar w/ scipy yet, sorry


def laplace_of_gaussian(gray_img, sigma=1., kappa=0.75, pad=False):
    """
    Applies Laplacian of Gaussians to grayscale image.

    :param gray_img: image to apply LoG to
    :param sigma:    Gauss sigma of Gaussian applied to image, <= 0. for none
    :param kappa:    difference threshold as factor to mean of image values, <= 0 for none
    :param pad:      flag to pad output w/ zero border, keeping input image size
    """
    assert len(gray_img.shape) == 2
    img = cv2.GaussianBlur(gray_img, (0, 0), sigma) if 0. < sigma else gray_img
    img = cv2.Laplacian(img, cv2.CV_64F)
    rows, cols = img.shape[:2]
    # min/max of 3x3-neighbourhoods
    min_map = np.minimum.reduce(list(img[r:rows-2+r, c:cols-2+c]
                                     for r in range(3) for c in range(3)))
    max_map = np.maximum.reduce(list(img[r:rows-2+r, c:cols-2+c]
                                     for r in range(3) for c in range(3)))
    # bool matrix for image value positiv (w/out border pixels)
    pos_img = 0 < img[1:rows-1, 1:cols-1]
    # bool matrix for min < 0 and 0 < image pixel
    neg_min = min_map < 0
    neg_min[1 - pos_img] = 0
    # bool matrix for 0 < max and image pixel < 0
    pos_max = 0 < max_map
    pos_max[pos_img] = 0
    # sign change at pixel?
    zero_cross = neg_min + pos_max
    # values: max - min, scaled to 0--255; set to 0 for no sign change
    value_scale = 255. / max(1., img.max() - img.min())
    values = value_scale * (max_map - min_map)
    values[1 - zero_cross] = 0.
    # optional thresholding
    if 0. <= kappa:
        thresh = float(np.absolute(img).mean()) * kappa
        values[values < thresh] = 0.
    log_img = values.astype(np.uint8)
    if pad:
        log_img = np.pad(log_img, pad_width=1, mode='constant', constant_values=0)
    return log_img


def _main():
    """Test routine"""
    # load grayscale image
    img = scipy.misc.face()  # lena removed from newer scipy versions
    img = cv2.cvtColor(img, cv2.COLOR_BGR2GRAY)
    # apply LoG
    log = laplace_of_gaussian(img)
    # display
    cv2.imshow('LoG', log)
    cv2.waitKey(0)


if __name__ == '__main__':
    _main()
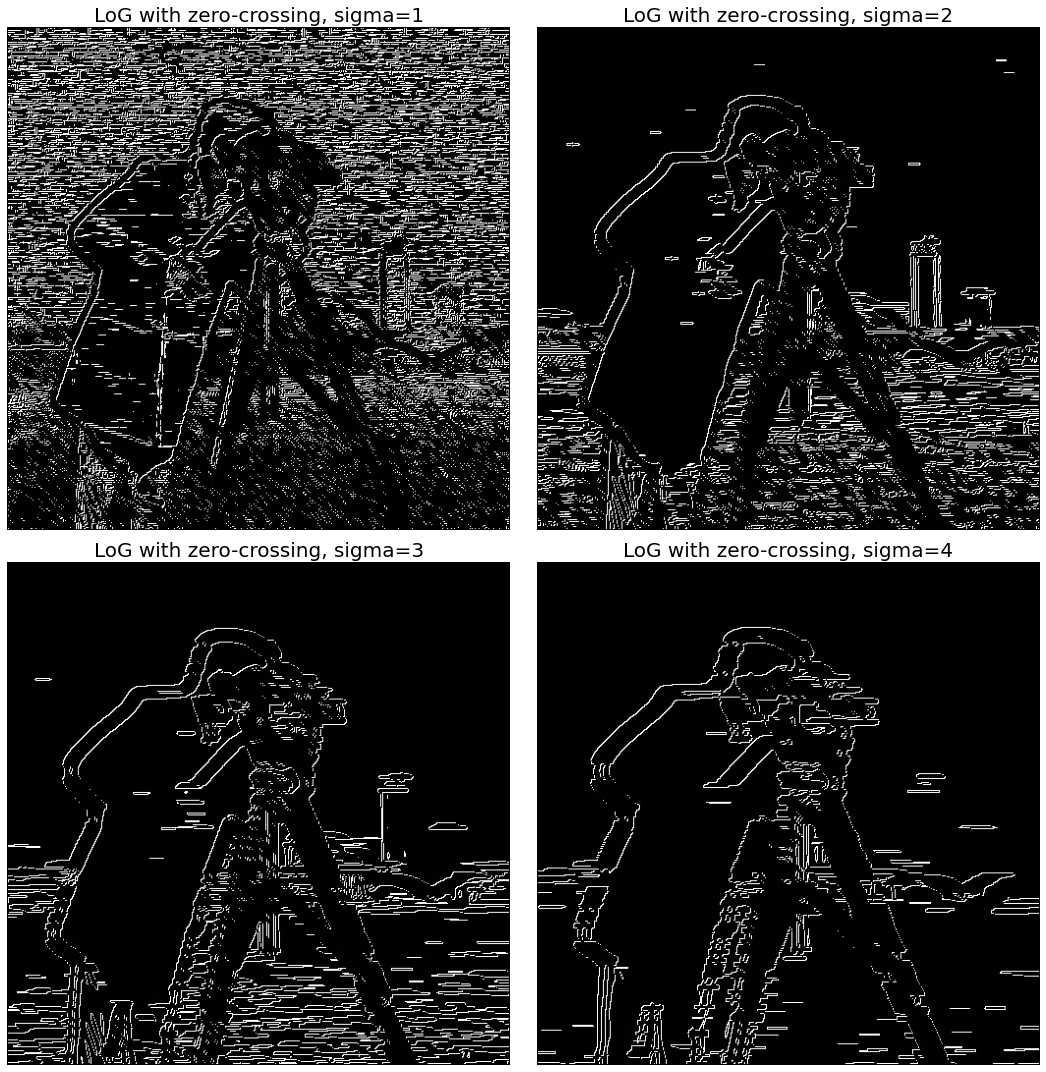
from scipy import ndimage, misc
import matplotlib.pyplot as plt
from skimage.color import rgb2gray
from skimage import data

def any_neighbor_zero(img, i, j):
    for k in range(-1,2):
      for l in range(-1,2):
         if img[i+k, j+k] == 0:
            return True
    return False

def zero_crossing(img):
    img[img > 0] = 1
    img[img < 0] = 0
    out_img = np.zeros(img.shape)
    for i in range(1,img.shape[0]-1):
        for j in range(1,img.shape[1]-1):
            if img[i,j] > 0 and any_neighbor_zero(img, i, j):
                out_img[i,j] = 255
    return out_img

img = data.camera()

fig = plt.figure(figsize=(15,15))
plt.gray() # show the filtered result in grayscale

for sigma in range(1,5):
    plt.subplot(2,2,sigma)
    result = ndimage.gaussian_laplace(img, sigma=sigma)
    plt.imshow(zero_crossing(result))
    plt.axis('off')
    plt.title('LoG with zero-crossing, sigma=' + str(sigma), size=20)

plt.tight_layout()
plt.show()