我正在尝试使用hexbin在一个正方形坐标轴上绘制一些数据。 我使用以下代码:
import matplotlib.cm as cm
plt.figure()
num_pts = 1000
x = rand(num_pts) * 100
y = rand(num_pts) * 250
x_min = 0
x_max = 150
x_step = 25

y_min = 50
y_max = 300
y_step = 50

s = plt.subplot(1,1,1)
plt.hexbin(x,y,cmap=cm.jet,gridsize=20)
plt.xticks(range(x_min,x_max+x_step,x_step))
plt.yticks(range(y_min,y_max+y_step,y_step))
# square axes
s.axes.set_aspect(1/s.axes.get_data_ratio())
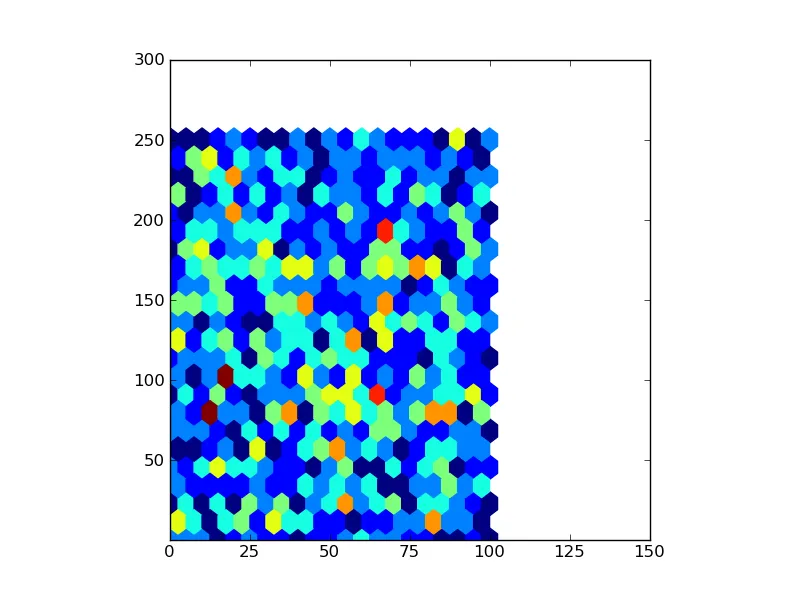
我希望坐标轴是正方形的,我想设置自己的xticks/yticks和x-y限制。对于一些坐标轴值,没有数据,因此hexbin计算的计数应该为零——我希望hexbin将其绘制为空白空间,而不是使用cm.jet colormap时保持“白色”/空白。
现在我得到的是这个样子。
如何让它使用它的colormap填充空白空间?谢谢。