如何在Matplotlib中填充任意闭合区域?

7

让我先说一下我的位置:

enter image description here

我用以下代码创建了上面的图片:
import matplotlib.pyplot as plt
import numpy as np

color_palette_name = 'gist_heat'
cmap = plt.cm.get_cmap(color_palette_name)
bgcolor = cmap(np.random.rand())

f = plt.figure(figsize=(12, 12), facecolor=bgcolor,)
ax = f.add_subplot(111)
ax.axis('off')

t = np.linspace(0, 2 * np.pi, 1000)

x = np.cos(t) + np.cos(6. * t) / 2.0 + np.sin(14. * t) / 3.0
y = np.sin(t) + np.sin(6. * t) / 2.0 + np.cos(14. * t) / 3.0

ax.plot(x, y, color=cmap(np.random.rand()))
ax.fill(x, y, color=cmap(np.random.rand()))
plt.tight_layout()
plt.savefig("../demo/tricky.png", facecolor=bgcolor, edgecolor=cmap(np.random.rand()), dpi=350)

有没有一种方法可以用其他颜色填充线条交叉时创建的循环(或类似三角形的区域)?它不必是matplotlib,也可以是scikit-image或其他库。

我在考虑一些伪代码,例如:

for region in regions:
    ax.fill(region, color=cmap(np.random.rand()))

但是我不知道如何获取regions,也不知道如何填充它。

1个回答

4
这个问题一开始对我来说似乎很简单,我的想法是使用blob分析来检测不同的斑点,按大小分组,并使用floodfill算法进行着色。
但是,我遇到了一些默认值的问题,这些默认值我没有修改,这浪费了一些时间。此外,我没有找到任何关于使用OpenCV进行洪水填充或给斑点着色的Python代码片段,而且针对SimpleBlobDetection的语法与旧版本相比发生了一些变化,我只能找到很少的文档和示例代码。所以,也许所有这些代码对其他用户也有用。
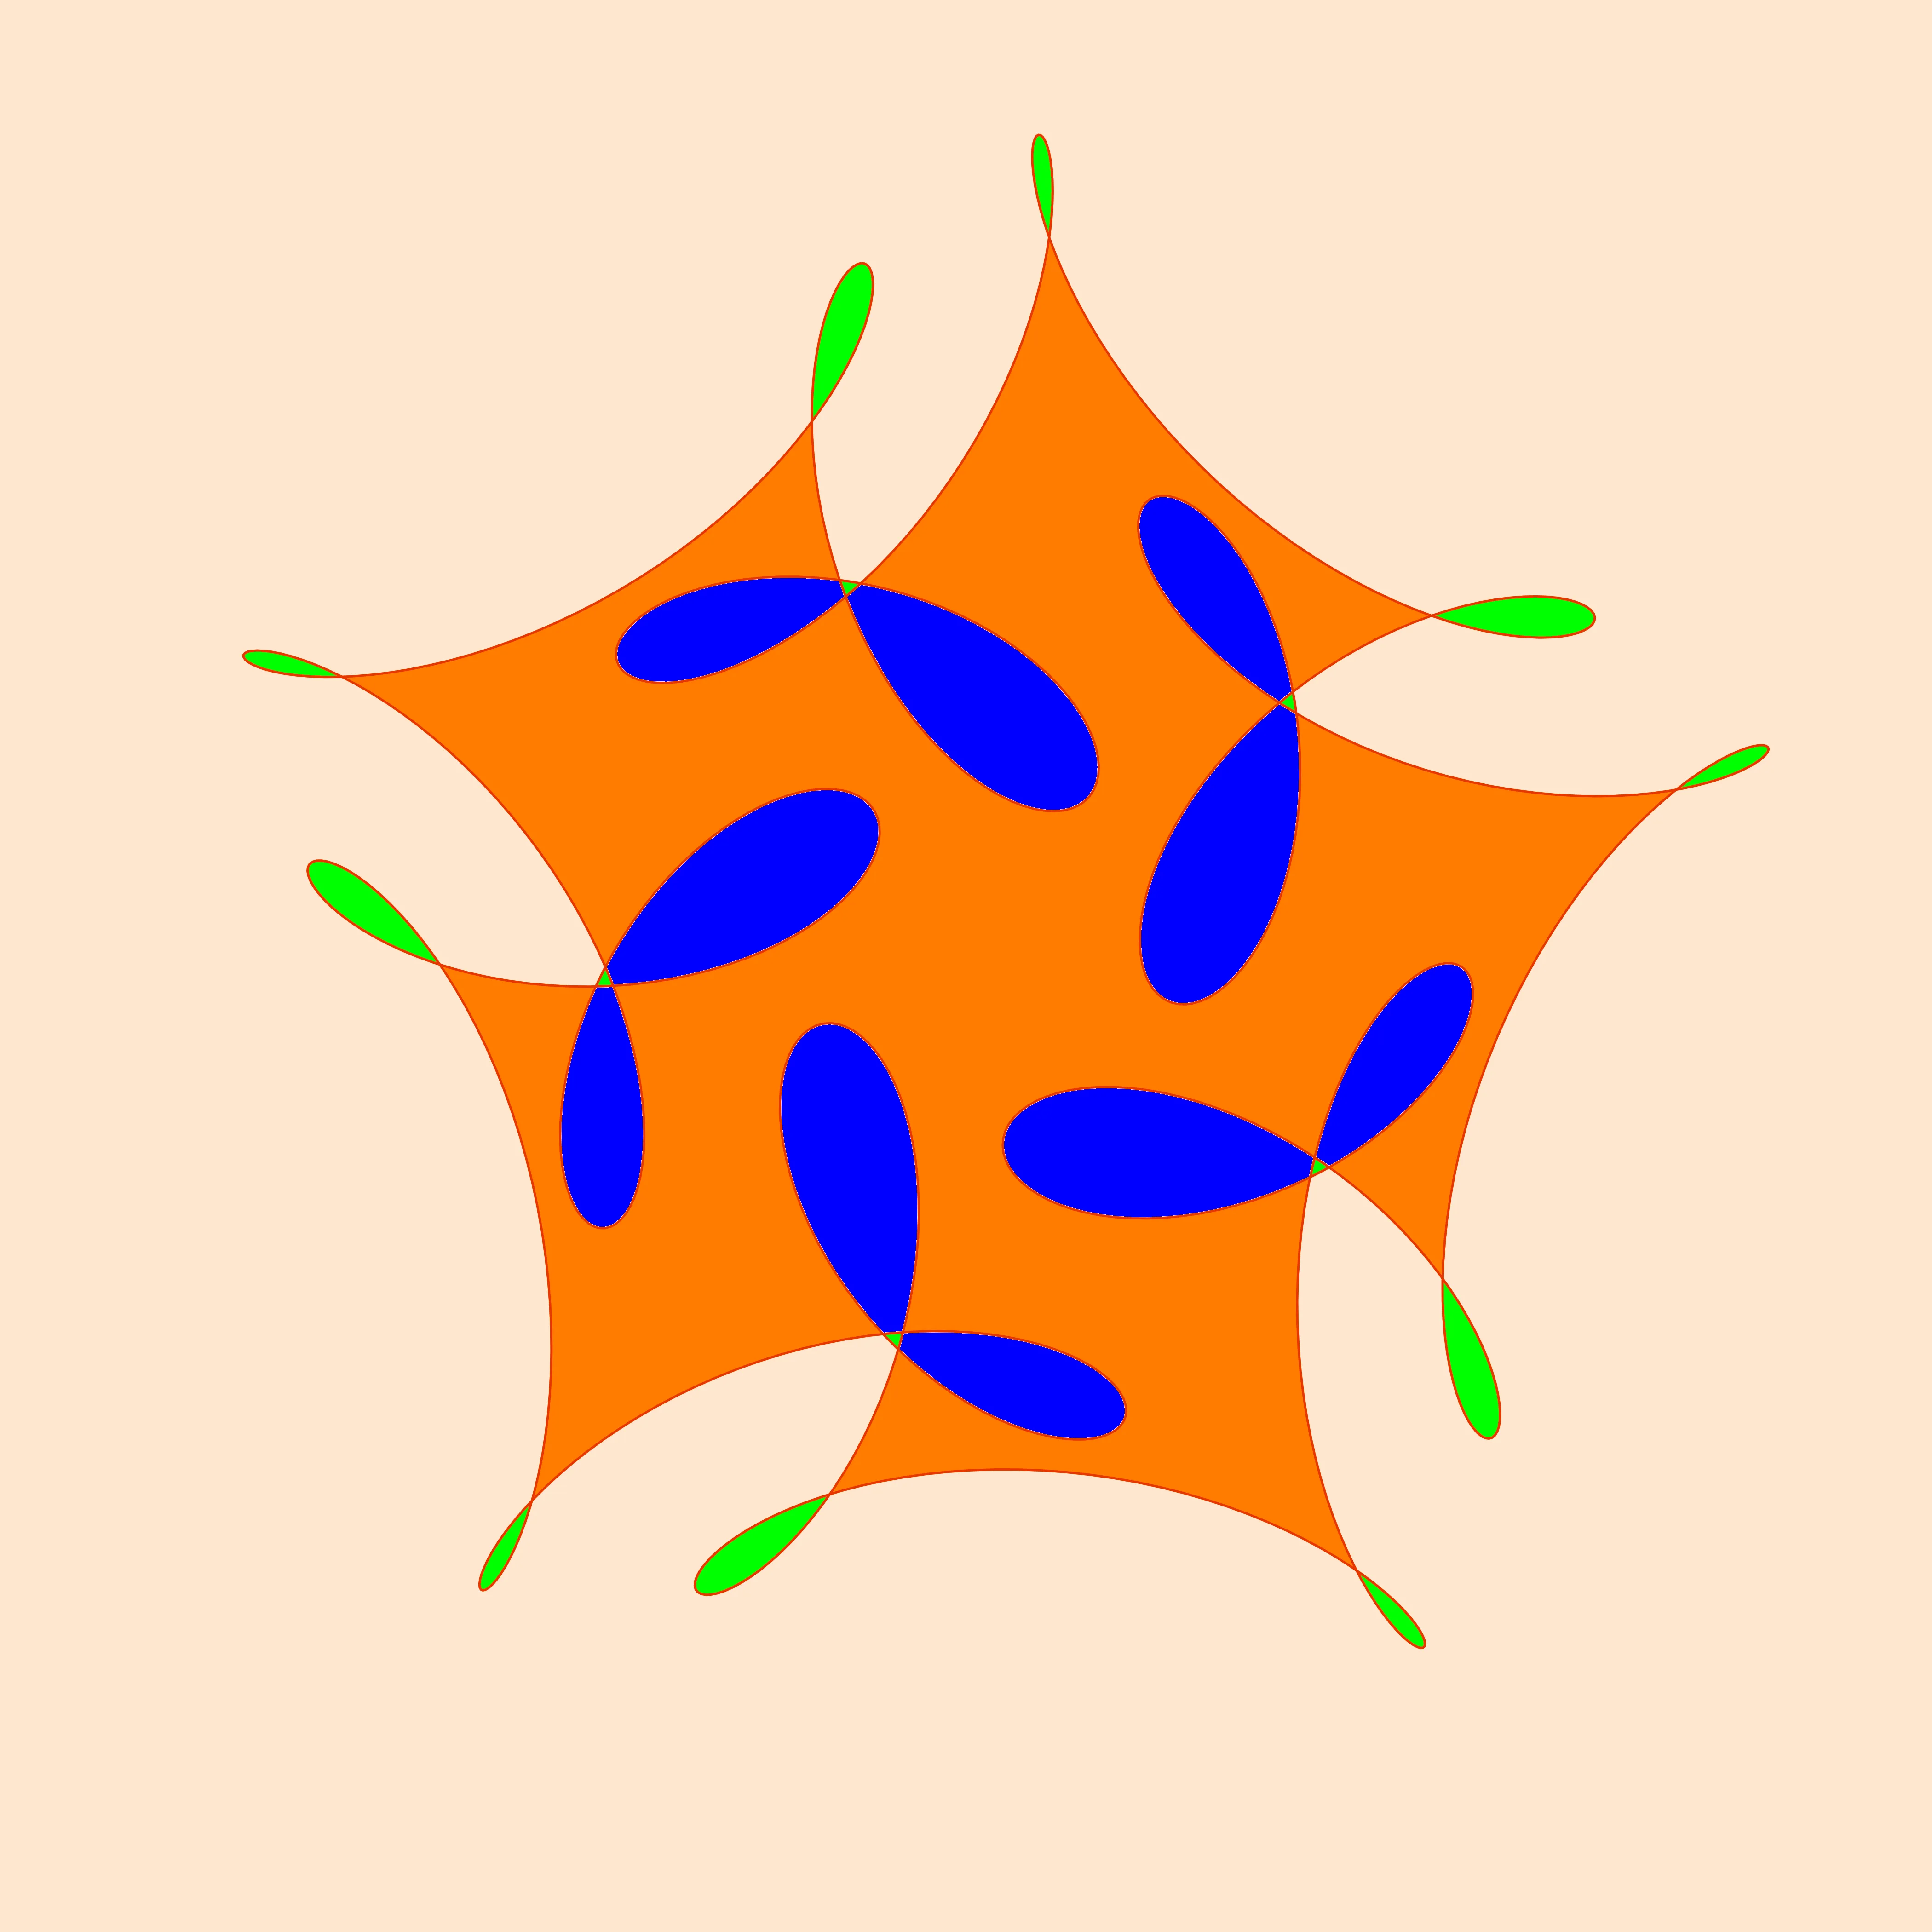
希望我正确地识别了您想要查找的部分。如果您不想包括大的黑色外叶,可以注释掉一行代码。
为了可视化,您可以调整图像的大小(目前已被注释,但请记得按4*4=16的系数相应调整大小阈值)。 enter image description here 尽管这个代码有点长,但希望易于阅读。在解决这个问题时,我学到了很多与OpenCV相关的知识,谢谢!
顺便说一句,这张图片很棒。
import numpy as np
import cv2

im = cv2.imread('tricky.png')

# For better visibility, resize image to better fit screen
#im= cv2.resize(im, dsize=(0,0),fx=0.25, fy=0.25)

#convert to gray value for blob analysis
imgray= cv2.cvtColor(im,cv2.COLOR_BGR2GRAY)


#### Blob analysis to find inner white leaves
# SimpleBlobDetector will find black blobs on white surface, this is why type=cv2.THRESH_BINARY_INV is necessary
ret,imthresh = cv2.threshold(imgray,160, 255,type=cv2.THRESH_BINARY_INV)

# Setup SimpleBlobDetector parameters.
params = cv2.SimpleBlobDetector_Params()

# Filter by Area.
params.filterByArea = True
params.minArea = 15000
params.maxArea = 150000

# Create a detector with the parameters
detector = cv2.SimpleBlobDetector_create(params)

# Detect blobs.
keypoints = detector.detect(imthresh)

# Draw detected blobs as red circles.
# cv2.DRAW_MATCHES_FLAGS_DRAW_RICH_KEYPOINTS ensures
# the size of the circle corresponds to the size of blob
im_with_keypoints = cv2.drawKeypoints(imthresh, keypoints, np.array([]), (0,0,255), cv2.DRAW_MATCHES_FLAGS_DRAW_RICH_KEYPOINTS)

# Show blobs
cv2.imshow("Keypoints", im_with_keypoints)


####floodfill inner white leaves with blue
#http://docs.opencv.org/3.0-beta/modules/imgproc/doc/miscellaneous_transformations.html

#Create a black mask for floodfill. Mask needs to be 2 pixel wider and taller
maskborder=imgray.copy()
maskborder[:] = 0
bordersize=1
maskborder=cv2.copyMakeBorder(maskborder, top=bordersize, bottom=bordersize, left=bordersize, right=bordersize, borderType= cv2.BORDER_CONSTANT, value=[255,255,255] )
print imgray.shape[:2]
print maskborder.shape[:2]

#Create result image for floodfill
result = im.copy()

#fill white inner segments with blue color
for k in keypoints:
    print int(k.pt[0]),int(k.pt[1])
    seed_pt = int(k.pt[0]),int(k.pt[1])
    cv2.floodFill(result, maskborder, seed_pt, (255,0, 0))


#### Blob analysis to find small triangles
# SimpleBlobDetector will find black blobs on white surface, this is why type=cv2.THRESH_BINARY_INV is necessary
ret,imthresh2 = cv2.threshold(imgray,150, 255,type=cv2.THRESH_BINARY)
ret,imthresh3 = cv2.threshold(imgray,140, 255,type=cv2.THRESH_BINARY_INV)
imthresh4 = cv2.add(imthresh2,imthresh3)

# Setup SimpleBlobDetector parameters.
params = cv2.SimpleBlobDetector_Params()

# Filter by Area.
params.filterByArea = True
params.minArea = 20
params.maxArea = 1000
params.maxArea = 50000 #Using this line includes the outer dark leaves. Comment out if necessary

# Don't filter by Circularity
params.filterByCircularity = False

# Don't filter by Convexity
params.filterByConvexity = False

# Don't filter by Inertia
params.filterByInertia = False

# Create a detector with the parameters
detector = cv2.SimpleBlobDetector_create(params)

# Detect blobs.
keypoints = detector.detect(imthresh4)

# Draw detected blobs as red circles.
# cv2.DRAW_MATCHES_FLAGS_DRAW_RICH_KEYPOINTS ensures
# the size of the circle corresponds to the size of blob
im_with_keypoints2 = cv2.drawKeypoints(imthresh4, keypoints, np.array([]), (0,0,255), cv2.DRAW_MATCHES_FLAGS_DRAW_RICH_KEYPOINTS)

# Show blobs
cv2.imshow("Keypoints2", im_with_keypoints2)


####floodfill triangles with green
#http://docs.opencv.org/3.0-beta/modules/imgproc/doc/miscellaneous_transformations.html

#Create a black mask for floodfill. Mask needs to be 2 pixel wider and taller
maskborder=imgray.copy()
maskborder[:] = 0
bordersize=1
maskborder=cv2.copyMakeBorder(maskborder, top=bordersize, bottom=bordersize, left=bordersize, right=bordersize, borderType= cv2.BORDER_CONSTANT, value=[255,255,255] )
print imgray.shape[:2]
print maskborder.shape[:2]

#Create result image for floodfill
result2 = result.copy()

#fill triangles with green color
for k in keypoints:
    print int(k.pt[0]),int(k.pt[1])
    seed_pt = int(k.pt[0]),int(k.pt[1])
    cv2.floodFill(result2, maskborder, seed_pt, (0,255, 0))


#cv2.imshow('main',im)
#cv2.imshow('gray',imgray)
#cv2.imshow('borders',maskborder)
#cv2.imshow('threshold2',imthresh2)
#cv2.imshow('threshold3',imthresh3)
#cv2.imshow('threshold4',imthresh4)
cv2.imshow("Result", result2)
cv2.imwrite("result.png",result2)

cv2.waitKey(0)
cv2.destroyAllWindows()

网页内容由stack overflow 提供, 点击上面的
可以查看英文原文,
原文链接