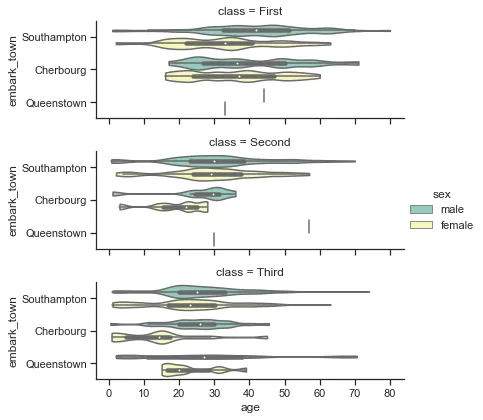
让我们考虑以下示例(来源于 Seaborn 文档):
titanic = sns.load_dataset("titanic")

fg = sns.catplot(x="age", y="embark_town",
                hue="sex", row="class",
                data=titanic[titanic.embark_town.notnull()],
                orient="h", height=2, aspect=3, palette="Set3",
                kind="violin", dodge=True, cut=0, bw=.2)
输出:
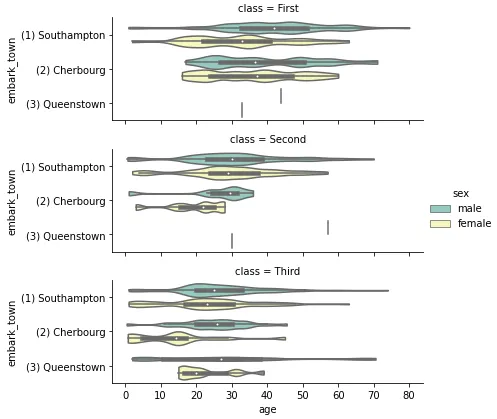
我想要更改y轴的刻度标签,例如在数字前加括号:(1)南安普敦,(2)瑟堡,(3)昆士敦。我看到了这个答案,并且尝试使用FuncFormatter,但是结果很奇怪。以下是我的代码:
titanic = sns.load_dataset("titanic")

fg = sns.catplot(x="age", y="embark_town",
                hue="sex", row="class",
                data=titanic[titanic.embark_town.notnull()],
                orient="h", height=2, aspect=3, palette="Set3",
                kind="violin", dodge=True, cut=0, bw=.2)

from matplotlib.ticker import FuncFormatter
for ax in fg.axes.flat:
    ax.yaxis.set_major_formatter(ticker.FuncFormatter(lambda x, pos: f'({1 + pos}) {x}'))
这是输出内容:
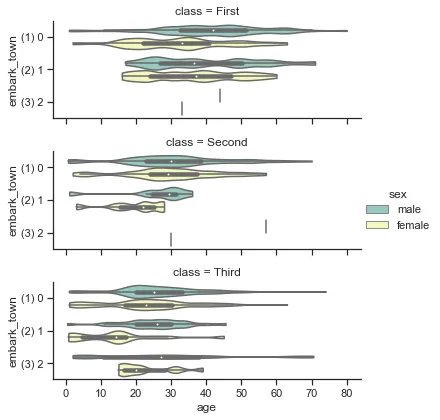
看起来x与lambda中的pos相同。我预期x应该是刻度标签的值(即Southampton,Cherbourg,Queenstown)。我做错了什么?
软件版本:
matplotlib                         3.4.3
seaborn                            0.11.2