如何为每个子图添加标题

456

我有一个图表,其中包含许多子图。

fig = plt.figure(num=None, figsize=(26, 12), dpi=80, facecolor='w', edgecolor='k')
fig.canvas.set_window_title('Window Title')

# Returns the Axes instance
ax = fig.add_subplot(311) 
ax2 = fig.add_subplot(312) 
ax3 = fig.add_subplot(313) 
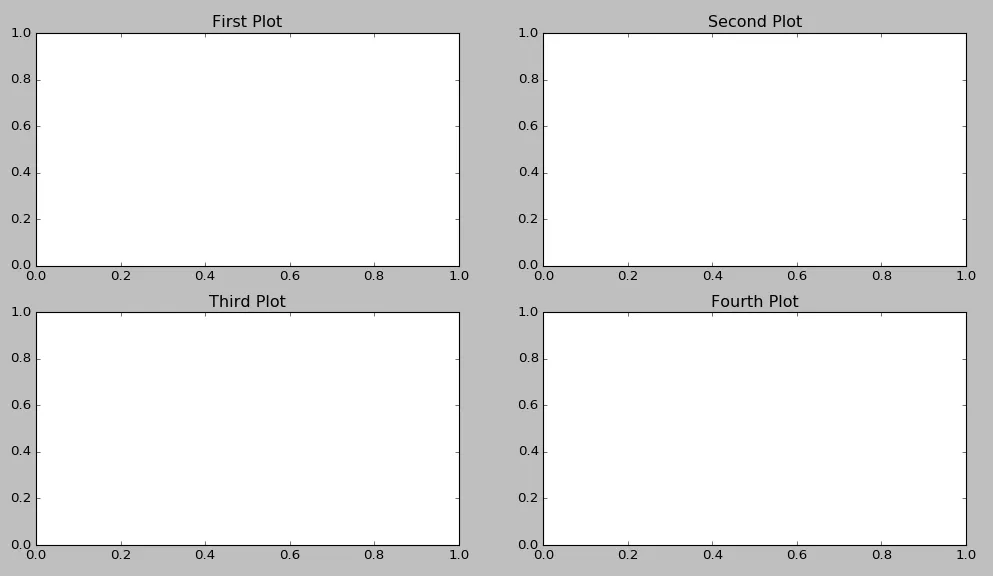
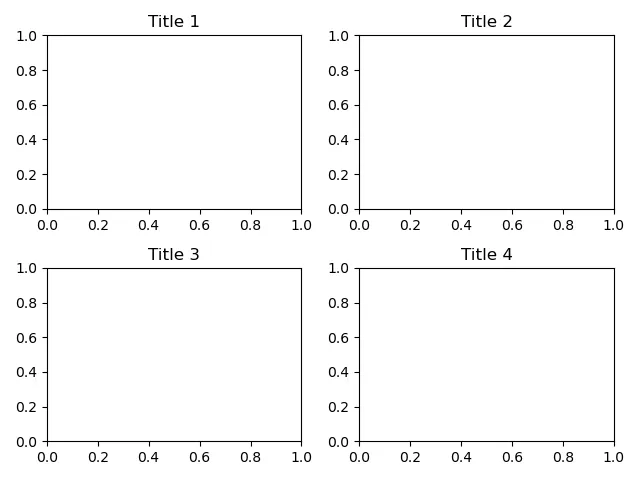
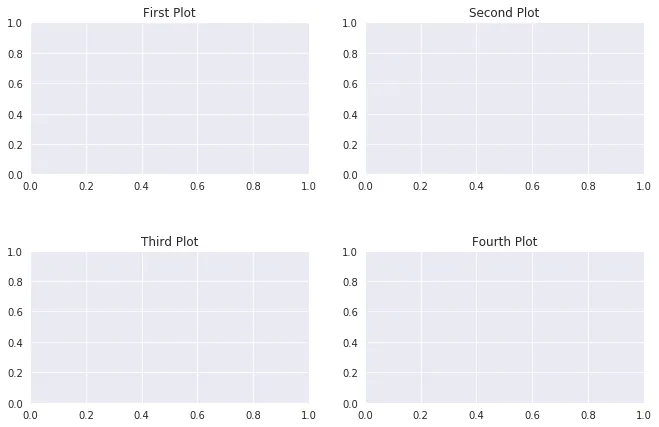
我该如何给子图添加标题?

fig.suptitle会向所有图形添加标题,而虽然ax.set_title()存在,但后者不会向我的子图添加任何标题。

感谢您的帮助。

编辑: 更正了有关set_title()的拼写错误。感谢Rutger Kassies。

10个回答

504

ax.title.set_text('My Plot Title') 看起来也可以正常工作。

fig = plt.figure()
ax1 = fig.add_subplot(221)
ax2 = fig.add_subplot(222)
ax3 = fig.add_subplot(223)
ax4 = fig.add_subplot(224)
ax1.title.set_text('First Plot')
ax2.title.set_text('Second Plot')
ax3.title.set_text('Third Plot')
ax4.title.set_text('Fourth Plot')
plt.show()

matplotlib添加子图标题


对于那些直方图字体大小有问题的人来说,有趣的是减少箱子的数量让我增加了字体大小。从500减少到100。 - mLstudent33
9
如果您需要指定字体大小,请使用 
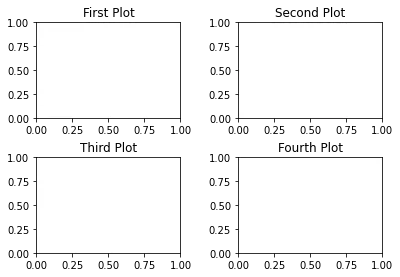
ax.set_title('标题', fontsize=16)。请注意,在这种情况下,将标题大小设置为所需的大小。 - Tobias P. G.
@TobiasP.G.,你如何将标题放置在子图内部? - Hitanshu Sachania
1
嗨@Jarad,感谢您的回答。当时我使用了ax2.text(),因为ax2.title.set_y()不知何故无法正常工作。给定4个相同大小的子图,如果我将每个子图的axis.title.set_y()赋值为$0.9$,它仍然会将标题放在奇怪的位置,并且每个子图之间不匹配。 - Hitanshu Sachania

325

ax.set_title() 应该为单独的子图设置标题:

import matplotlib.pyplot as plt

if __name__ == "__main__":
    data = [1, 2, 3, 4, 5]

    fig = plt.figure()
    fig.suptitle("Title for whole figure", fontsize=16)
    ax = plt.subplot("211")
    ax.set_title("Title for first plot")
    ax.plot(data)

    ax = plt.subplot("212")
    ax.set_title("Title for second plot")
    ax.plot(data)

    plt.show()

你能检查一下这段代码是否对你有效吗?也许后面会有其他内容覆盖掉它们?


1
这对我有效,matplotlib版本1.2.2,Python 2.7.5。 - NameOfTheRose
1
在matplotlib 3.5.2上,plt.subplot("211") / plt.subplot("212")会引发ValueError。解决方法是将其替换为整数参数,即plt.subplot(211)和plt.subplot(212)。 - Giorgos Sfikas

64

假设使用了以下代码导入了matplotlib.pyplot

plt.gca().set_title('title')

如下所示:

plt.subplot(221)
plt.gca().set_title('title')
plt.subplot(222)
etc...

那么就没有必要使用多余的变量。


1
这种方法很好,因为它可以更好地控制标题的位置...例如,通过添加kwarg y=0.7,您可以在子图中绘制子图标题。 - CreekGeek

18

如果你想让它更短,你可以写成:

import matplotlib.pyplot as plt
for i in range(4):
    plt.subplot(2,2,i+1).set_title(f'Subplot n°{i+1}')
plt.show()

这可能会使它不太清晰,但你不需要更多的行或变量。


14

我越来越倾向于使用以下解决方案:

import matplotlib.pyplot as plt

fig, axs = plt.subplots(2, 2)  # 1
for i, ax in enumerate(axs.ravel()): # 2
    ax.set_title("Plot #{}".format(i)) # 3
  1. 创建任意数量的坐标轴
  2. axs.ravel()将您的二维对象转换为按行主序的一维向量
  3. 将标题分配给当前坐标轴对象

5

为了完整起见,可以通过以下方式实现所请求的结果,而无需明确引用图轴:

import matplotlib.pyplot as plt

plt.subplot(221)
plt.title("Title 1")

plt.subplot(222)
plt.title("Title 2")

plt.subplot(223)
plt.title("Title 3")

plt.subplot(224)
plt.title("Title 4")

enter image description here

如果您的标签重叠,请在最后一个图之后使用plt.tight_layout()

5
fig, (ax1, ax2, ax3, ax4) = plt.subplots(nrows=1, ncols=4,figsize=(11, 7))

grid = plt.GridSpec(2, 2, wspace=0.2, hspace=0.5)

ax1 = plt.subplot(grid[0, 0])
ax2 = plt.subplot(grid[0, 1:])
ax3 = plt.subplot(grid[1, :1])
ax4 = plt.subplot(grid[1, 1:])

ax1.title.set_text('First Plot')
ax2.title.set_text('Second Plot')
ax3.title.set_text('Third Plot')
ax4.title.set_text('Fourth Plot')

plt.show()

enter image description here


如何在子图和它们的标题之间添加间距。 - undefined

4

只需通过迭代,您就可以为每个图形赋予不同的标题和标签。

titles = {221: 'First Plot', 222: 'Second Plot', 223: 'Third Plot', 224: 'Fourth Plot'}
fig = plt.figure()
for x in range(221,225):
  ax = fig.add_subplot(x)
  ax.title.set_text(titles.get(x))

plt.subplots_adjust(left=0.1,
                    bottom=0.1, 
                    right=0.9, 
                    top=0.9, 
                    wspace=0.4, 
                    hspace=0.4)
plt.show()

输出:

输入图像描述


1
subplots_adjust函数的调用可以解决标题重叠问题。因此非常有用。谢谢! - marscher
如何在子图的标题和其图表之间添加一些空间。例如,标题“第一个图表”和其对应的图表之间的垂直空间。 - undefined

4
截至matplotlib 3.4.3版本,Figure.add_subplot 函数支持包含标题的kwargs参数:
fig.add_subplot(311, title="first")
fig.add_subplot(312, title="second")

1
简单而完美地工作(不知道为什么这个没有更多的赞)。 - Julia

4

如果你有多张图片并且想通过循环逐个显示它们以及对应的标题 - 你可以按照以下步骤实现。不需要显式地定义ax1、ax2等。

  1. 关键是可以像代码第一行那样定义动态轴(ax),并在循环内设置它的标题。
  2. 二维数组的行数是轴(ax)的长度(len)。
  3. 每行有两个元素,也就是说它是一个列表中的列表(点号2)。
  4. 一旦选择了正确的轴(ax)或子图(subplot),就可以使用set_title来设置标题。
import matplotlib.pyplot as plt    
fig, ax = plt.subplots(2, 2, figsize=(6, 8))  
for i in range(len(ax)): 
    for j in range(len(ax[i])):
        ## ax[i,j].imshow(test_images_gr[0].reshape(28,28))
        ax[i,j].set_title('Title-' + str(i) + str(j))

网页内容由stack overflow 提供, 点击上面的
可以查看英文原文,
原文链接