如何在每个子图中添加垂直线?

4
我将尝试使用.add_subplot()绘制多个直方图。 以下是我的部分代码:
    for j in range(nlayer):
        p_value_tensor_Wiki103_at_layer_j = p_value_tensor_Wiki103_at_layer[:,j].tolist()

        hist_j = fig.add_subplot(grid[0,j], xticklabels=[], yticklabels=[])
        hist_j.set_xlabel(labels_Wiki103[j],fontsize=3)

        # histogram on the attached axes
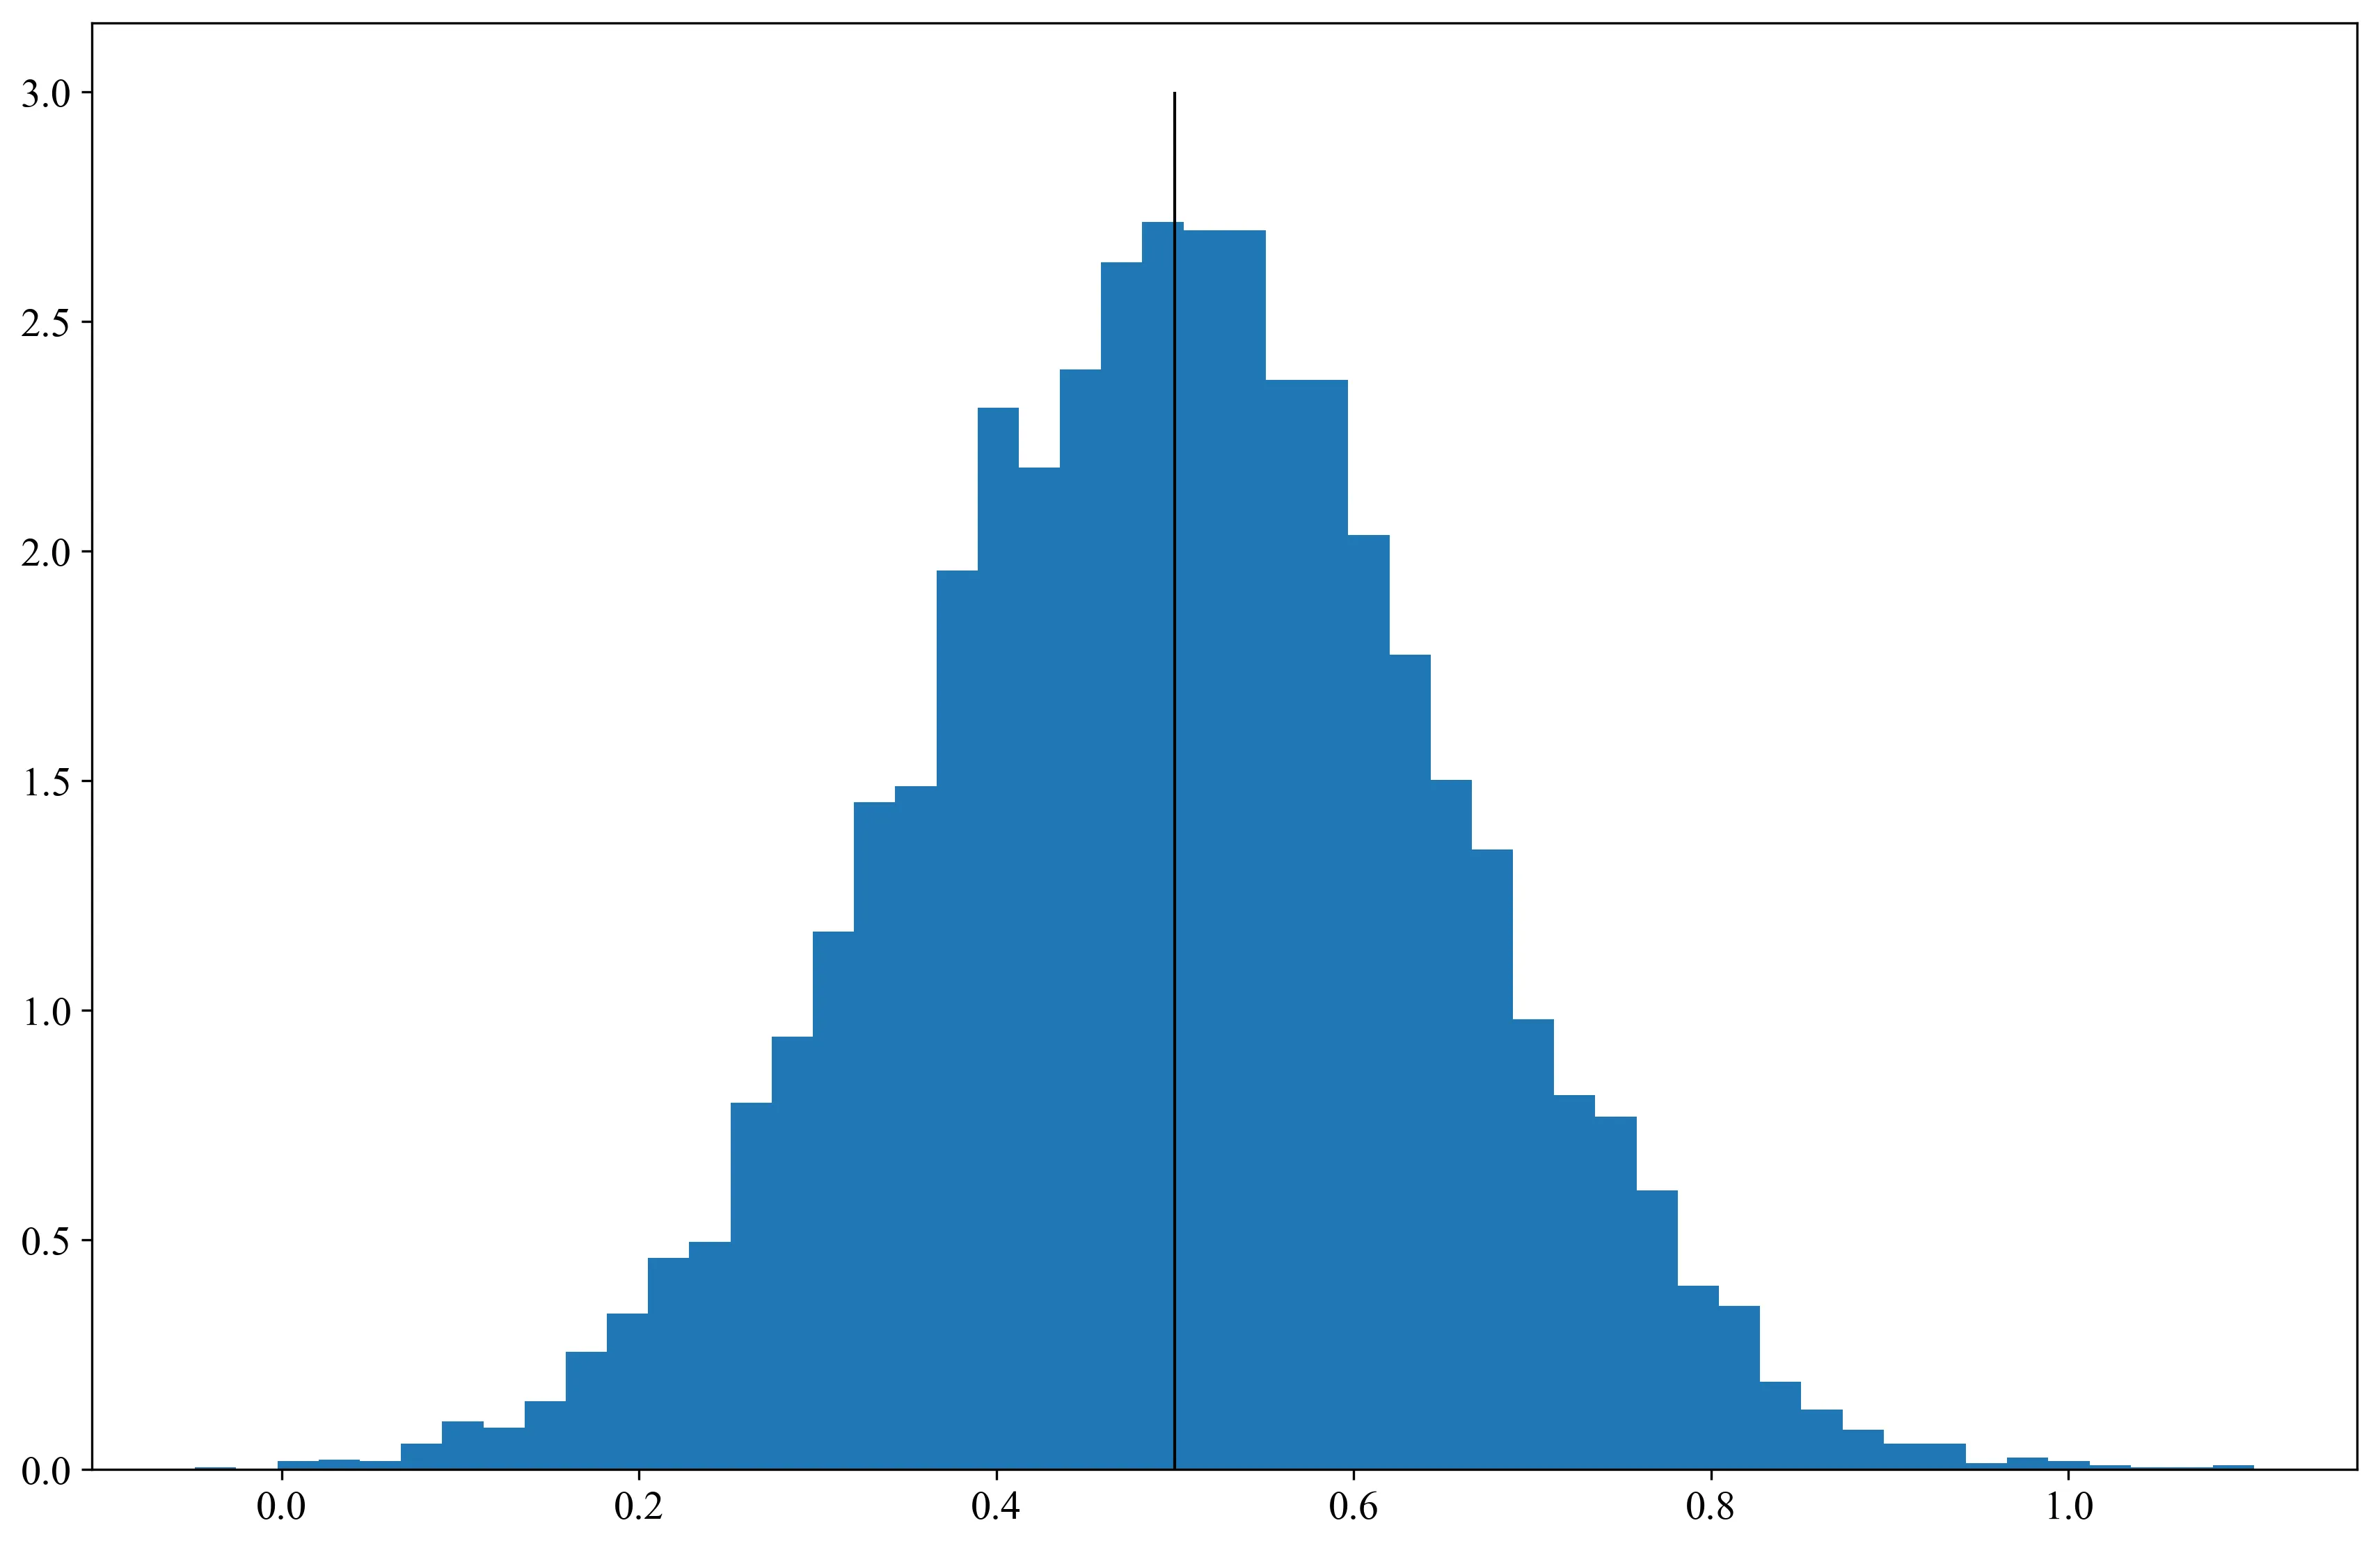
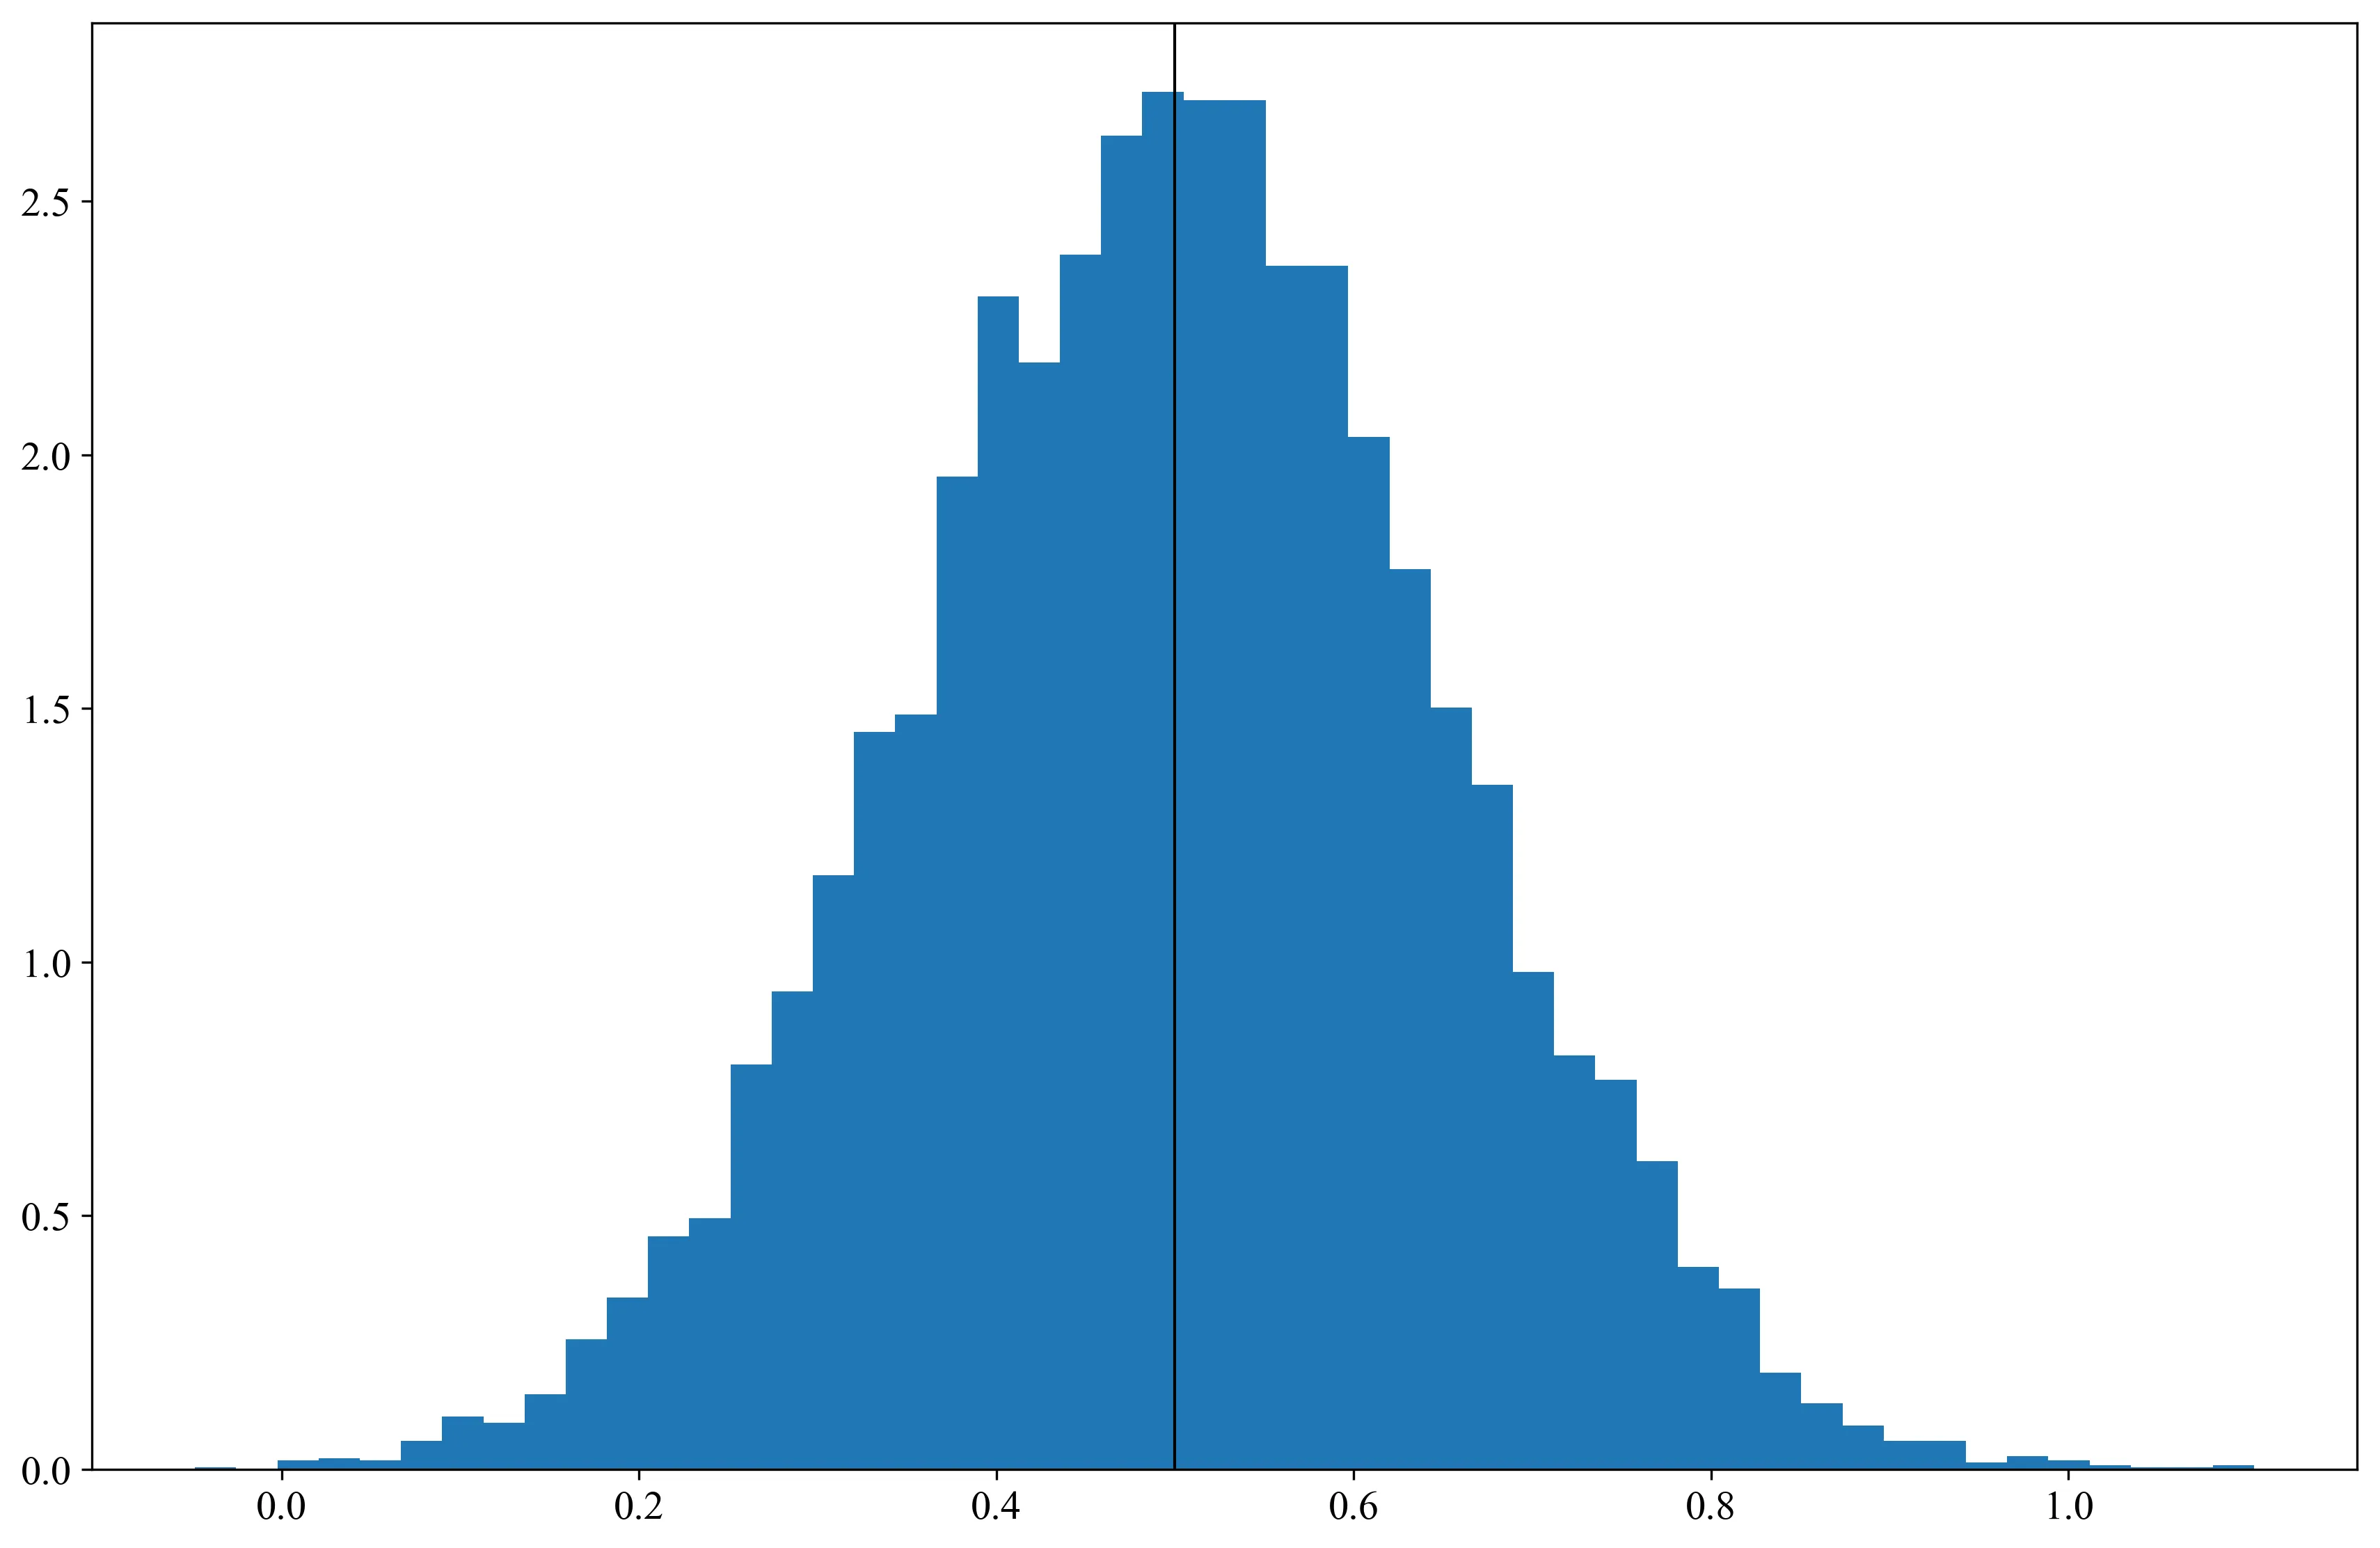
        hist_j.hist(p_value_tensor_Wiki103_at_layer_j, bins = 20)  

但是如果我想在我生成的每个子图上添加一个在x=0.05处垂直的线,该怎么办?

谢谢。


1
这个回答解决了你的问题吗?如何在matplotlib中给定的图中绘制垂直线? - AMC
1个回答

3

使用matplotlib.pyplot.vlinesmatplotlib.pyplot.axvline,用法:

import matplotlib.pyplot as plt
import numpy as np

np.random.seed(1)
mu, sigma = 0.5, 0.15
x = mu + sigma * np.random.randn(10000)

fig, ax = plt.subplots(1)

ax.hist(x, 50, density=1)
ax.vlines(0.5,0,3)
plt.show()

enter image description here

ax.hist(x, 50, density=1)
ax.axvline(0.5)
plt.show()

enter image description here

在您的使用情况下,您只需执行以下操作
for j in range(nlayer):
    #...
    hist_j.axvline(0.5)
    # or to draw a line from ymin to ymax
    hist_j.vlines(0.5, ymin, ymax)

网页内容由stack overflow 提供, 点击上面的
可以查看英文原文,
原文链接