我正在尝试使用LOWESS来平滑以下数据:
当我运行这段代码时,出现以下错误:
``` ValueError: 视图限制最小值-7.641460199922635e+16小于1且是无效的Matplotlib日期值。如果您将非日期时间值传递给具有日期时间单位的轴,则经常会发生这种情况。 ```
我的数据中的日期格式为07/05/2018 00:07:00。我认为问题在于LOWESS难以处理日期时间数据,但不确定?
请问你能帮我解决吗?
import pandas as pd
import matplotlib.pyplot as plt
from matplotlib.dates import HourLocator, DayLocator, DateFormatter
from statsmodels.nonparametric.smoothers_lowess import lowess
file = r'C:...'
df = pd.read_csv(file) # reads data file
df['Date'] = pd.to_datetime(df['Time Local'], format='%d/%m/%Y %H:%M')
x = df['Date']
y1 = df['CTk2 Level']
filtered = lowess(y1, x, is_sorted=True, frac=0.025, it=0)
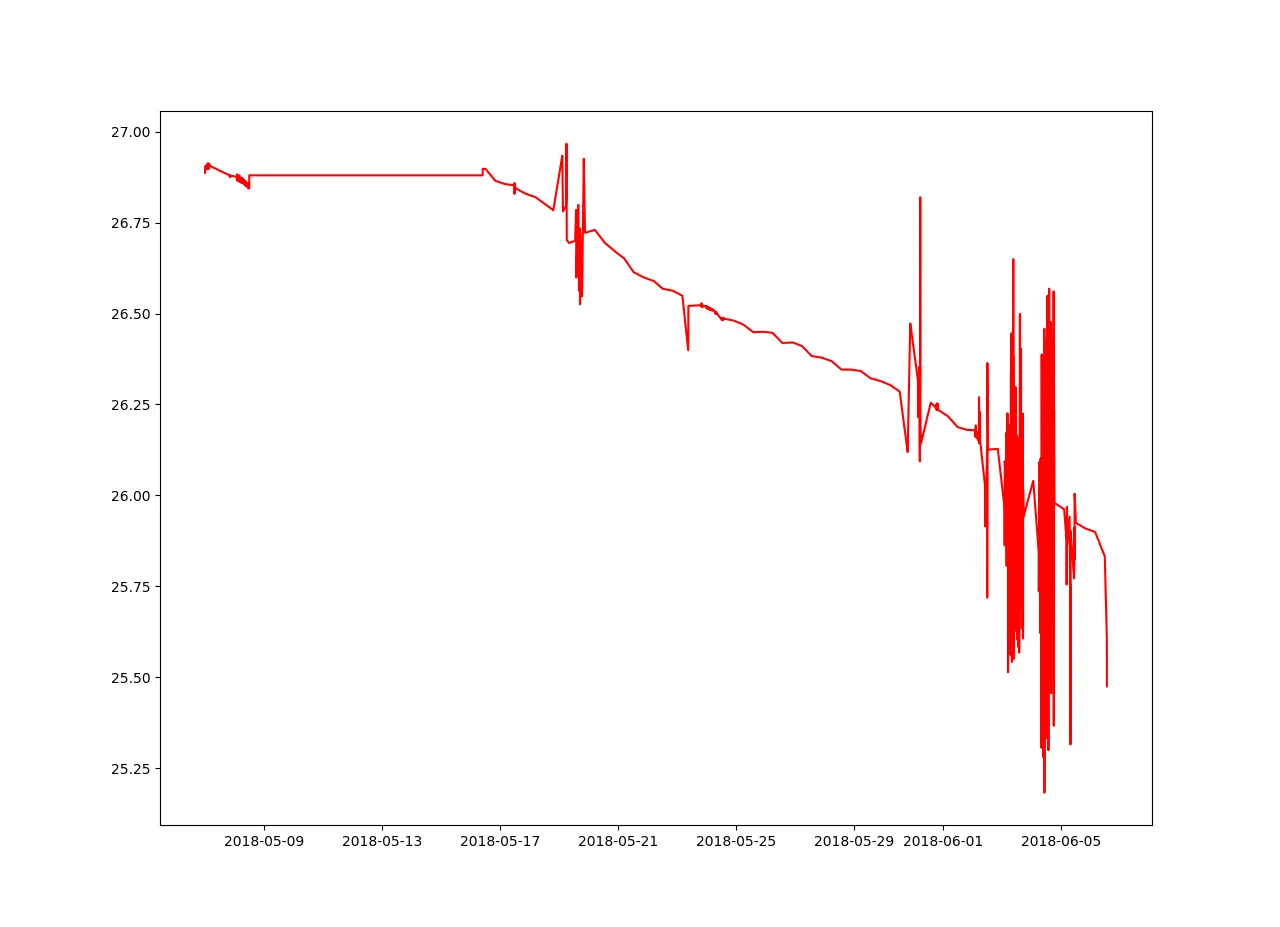
plt.plot(x, y1, 'r')
plt.plot(filtered[:,0], filtered[:,1], 'b')
plt.show()
当我运行这段代码时,出现以下错误:
``` ValueError: 视图限制最小值-7.641460199922635e+16小于1且是无效的Matplotlib日期值。如果您将非日期时间值传递给具有日期时间单位的轴,则经常会发生这种情况。 ```
我的数据中的日期格式为07/05/2018 00:07:00。我认为问题在于LOWESS难以处理日期时间数据,但不确定?
请问你能帮我解决吗?
lowess完成的。x是一个DataTimeIndex,但返回的smoothedx只是一个浮点数数组。 - chthonicdaemon