分组水平箱线图与bwplot

5
我有以下代码,它可以通过lattice中的bwplot函数实现分组垂直箱线图。可重复的例子。
data(mpg, package = "ggplot2") 

bwplot( hwy~class, data = mpg, groups = year,
    pch = "|", box.width = 1/3,
    auto.key = list(points = FALSE, rectangles = TRUE, space = "right"),
    panel = panel.superpose,
    panel.groups = function(x, y, ..., group.number) {
        panel.bwplot(x + (group.number-1.5)/3, y, ...)
     })

这个代码正常工作,但是我想要盒形图是水平的,所以我更改了第一行,保持其他内容不变:

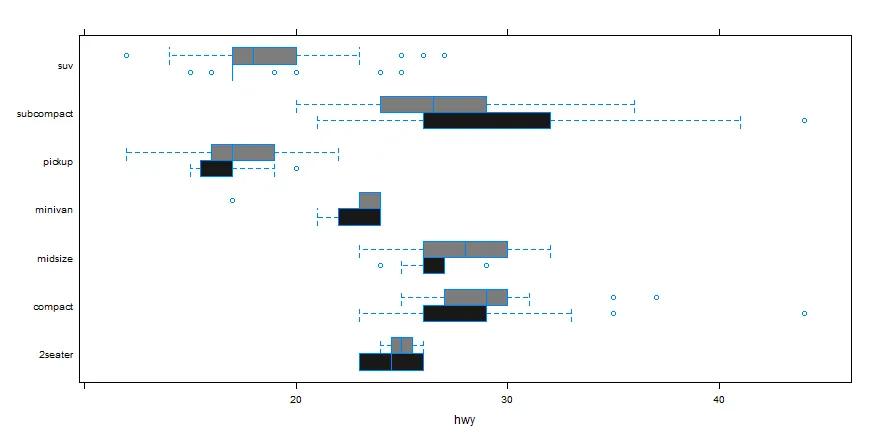
bwplot( class~hwy, data = mpg, groups = year, ...

但是图表的输出如下 Output。我已经尝试过修改代码但没有成功。我的问题有两个:第一,怎样或者是否可以使箱线图不重叠?第二,更普遍的问题,如何将颜色面板设置为灰度模式,让图表呈现出不同灰度或仅为黑白两色?

2个回答

6
  • panel.groups函数中,你还应该颠倒x和y的角色。
  • 使用trellis.par.set更改叠加符号的填充颜色。

enter image description here

data(mpg, package = "ggplot2") 
library(latticeExtra)
mycolors <- grey.colors(5, start = 0.1, end = 0.9)
trellis.par.set(superpose.symbol = list(fill = mycolors,col=mycolors))
bwplot(class~hwy, data = mpg, groups = year,
                pch = "|", box.width = 1/3,
                panel = panel.superpose,
                panel.groups = function(x, y,..., group.number) 
                    panel.bwplot(x,y + (group.number-1.5)/3,...)
            ) 

但在这里,使用ggplot2解决方案可能会更容易。


4

如果您不一定非要使用bwplot,可以尝试使用ggplot

ggplot(data = mpg, aes(x = class, y = hwy, fill = factor(year))) +
  geom_boxplot() +
  coord_flip() +
  scale_fill_grey(start = 0.5, end = 0.8) +
  theme_classic()

enter image description here


网页内容由stack overflow 提供, 点击上面的
可以查看英文原文,
原文链接