我整个上午都被这个问题困扰,但是无法解决。
我的数据每一行包括:时间戳、测量值、用户。
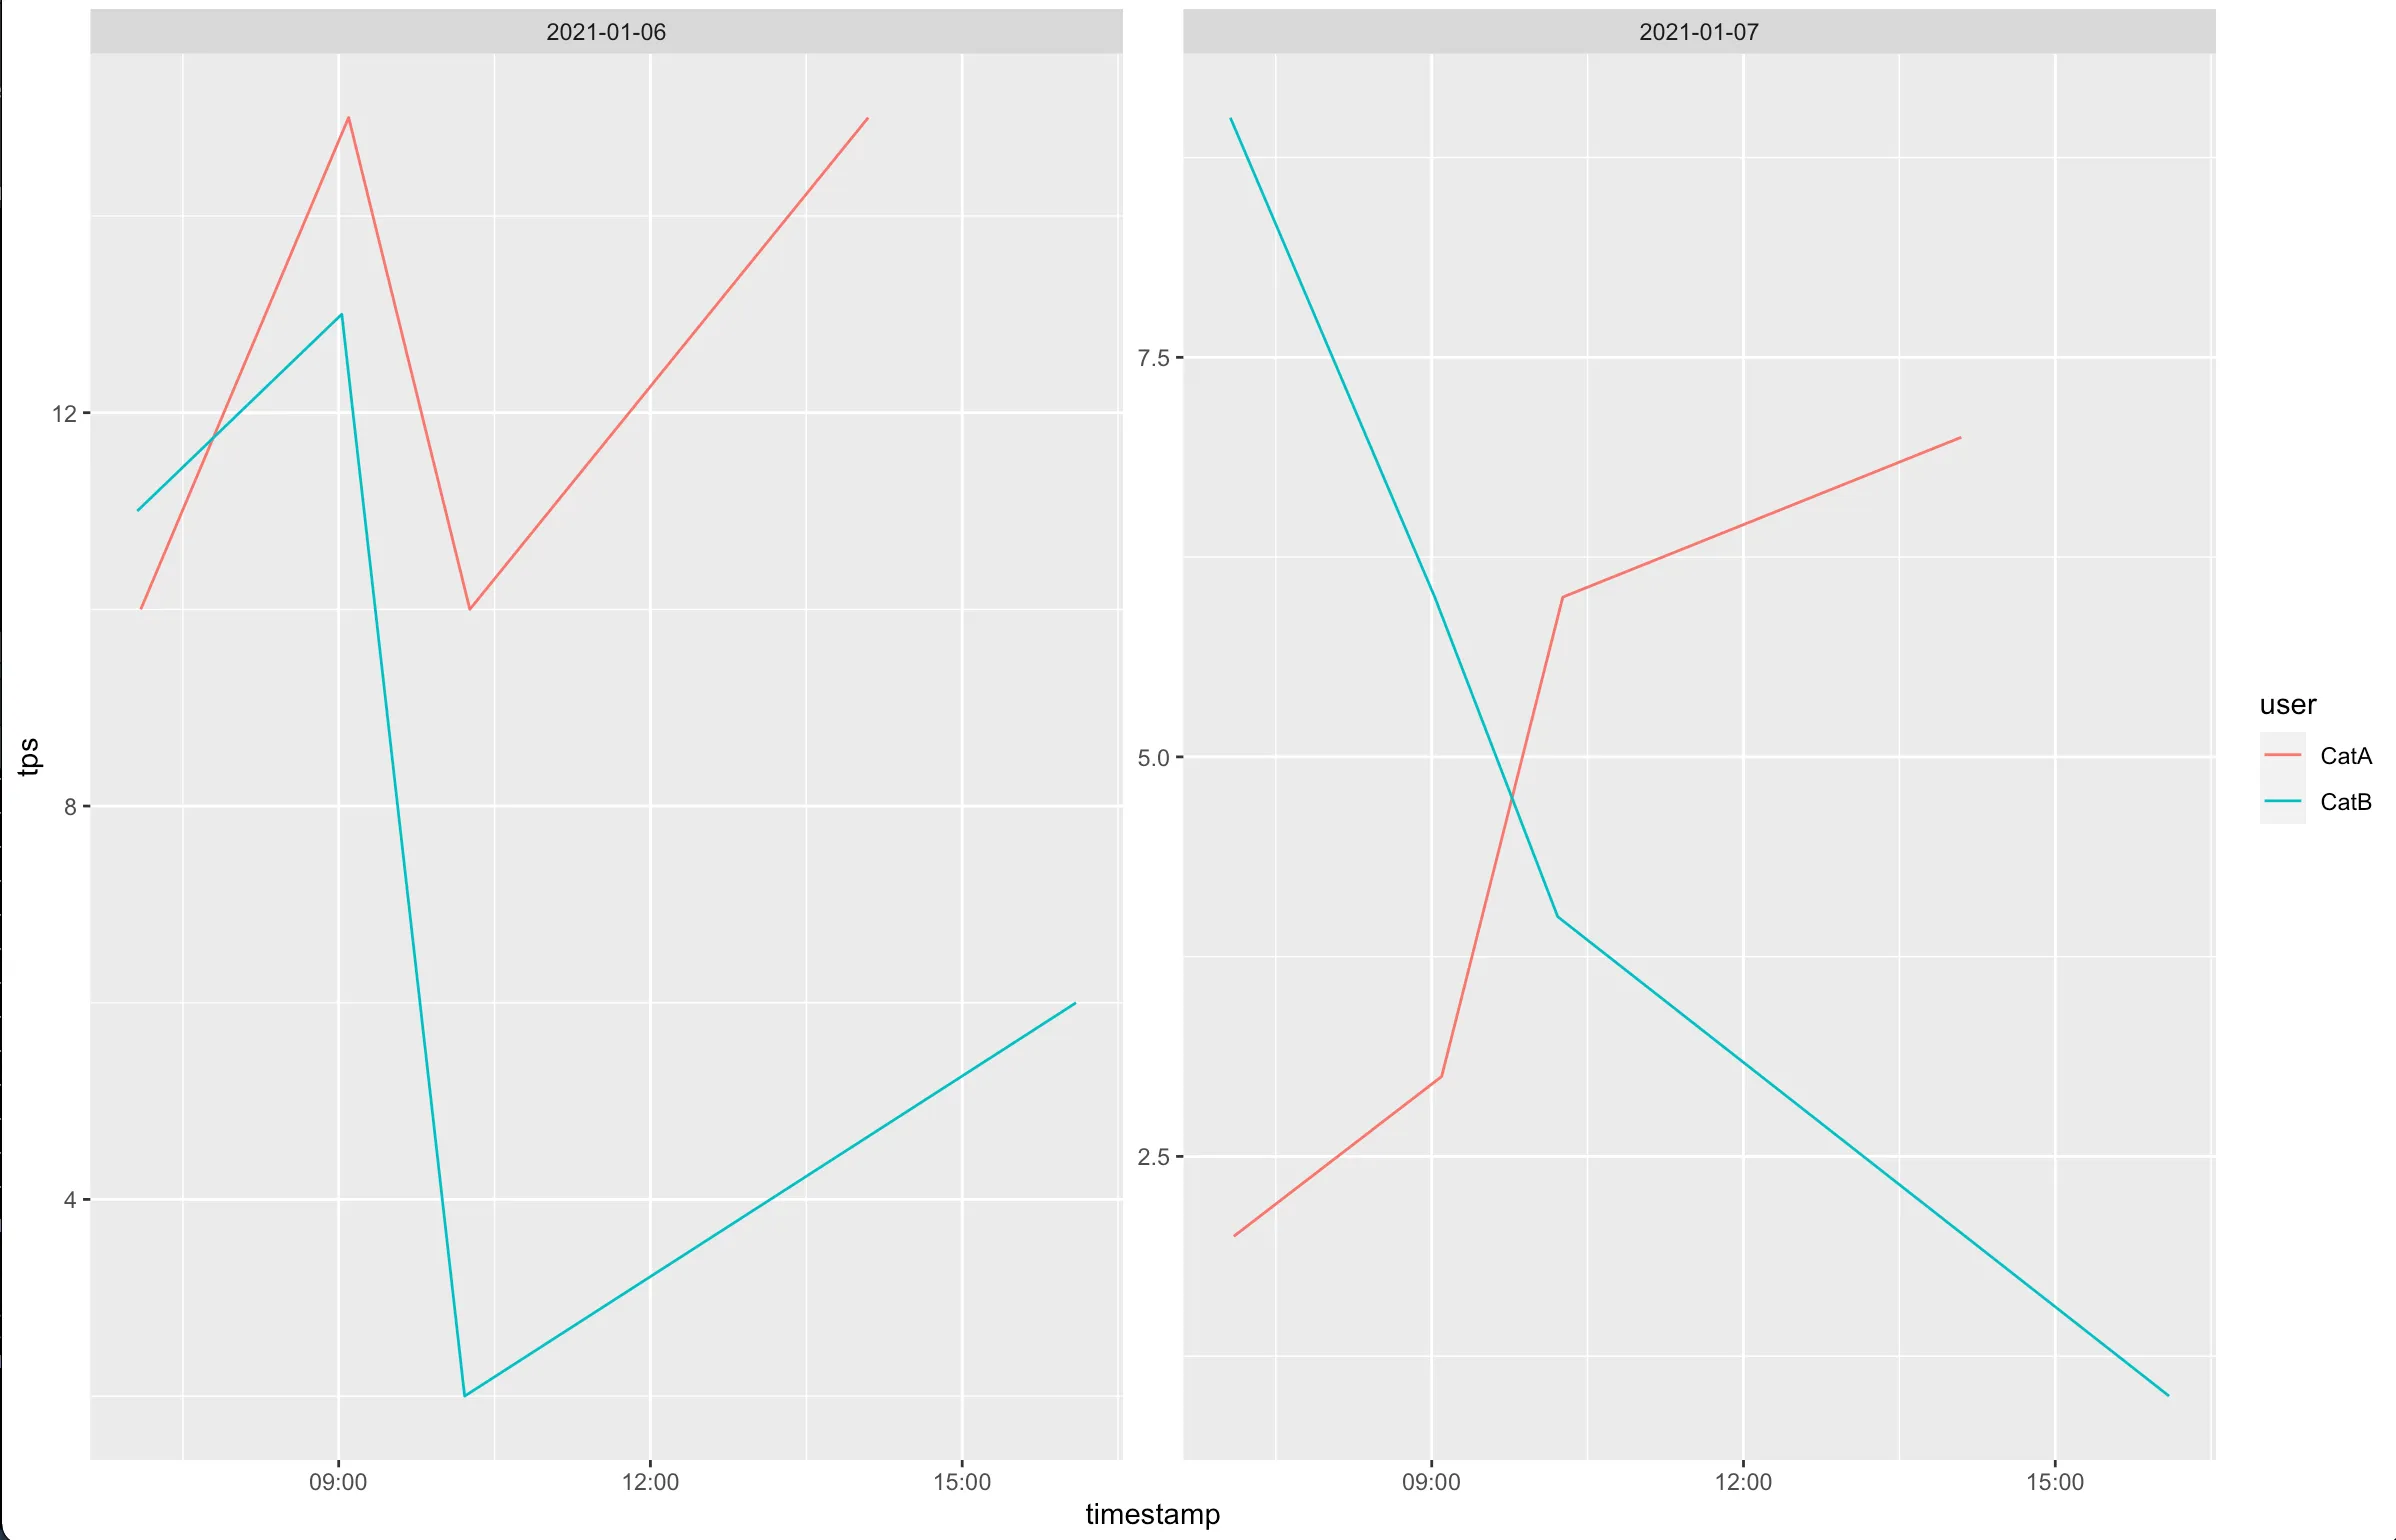
如果我将数据作为一个整体绘制,它能正常工作。但是,如果我尝试使用facet_wrap按日期绘制数据,则会出现错误:Error: scale_id must not be NA。
答案可能非常明显,但是我缺乏知识和关键词来自己找到答案。
下面是最简单的示例,它会出现错误。
非常感谢任何输入/建议。
Reprex:
library(tidyverse)

cols <- cols(
  timestamp = col_datetime(format = ""),
  tps = col_double(),
  user = col_character()
)

df <- read_csv("
timestamp,              tps,    user
2021-01-06 07:05:44,    10,    CatA
2021-01-06 09:05:44,    15,    CatA
2021-01-06 10:15:44,    10,    CatA
2021-01-06 14:05:44,    15,    CatA
2021-01-06 07:03:44,    11,    CatB
2021-01-06 09:01:44,    13,    CatB
2021-01-06 10:12:44,    2,     CatB
2021-01-06 16:05:44,    6,     CatB
2021-01-07 07:05:44,    2,     CatA
2021-01-07 09:05:44,    3,     CatA
2021-01-07 10:15:44,    6,     CatA
2021-01-07 14:05:44,    7,     CatA
2021-01-07 07:03:44,    9,     CatB
2021-01-07 09:01:44,    6,     CatB
2021-01-07 10:12:44,    4,     CatB
2021-01-07 16:05:44,    1,     CatB
", col_types = cols)

str(df)


#  tibble [16 x 4] (S3: spec_tbl_df/tbl_df/tbl/data.frame)
#   $ timestamp: POSIXct[1:16], format: "2021-01-06 07:05:44" "2021-01-06 09:05:44" "2021-01-06 10:15:44" "2021-01-06 14:05:44" ...
#   $ tps      : num [1:16] 10 15 10 15 11 13 2 6 2 3 ...
#   $ user     : chr [1:16] "CatA" "CatA" "CatA" "CatA" ...
#   - attr(*, "spec")=
#    .. cols(
#    ..   timestamp = col_datetime(format = ""),
#    ..   tps = col_double(),
#    ..   user = col_character()
#    .. )


#I then create a date variable:

df <- df %>%
  mutate(date = floor_date(
    timestamp,
    unit = "days",
    week_start = getOption("lubridate.week.start", 7))
  )


# This is where it fails:
ggplot(data=df, aes(x=timestamp, y=tps, color=user)) +
  geom_line() +
  scale_x_datetime() +
  facet_wrap( ~ date)


##########
# RESULT #
##########

#> ggplot(data=df, aes(x=timestamp, y=tps, color=user)) +
#+   geom_line() +
#+   scale_x_datetime() +
#+   facet_wrap( ~ date)
#Error: `scale_id` must not be `NA`