R版本3.1.1(2014年07月10日) 平台:i386-w64-mingw32/i386(32位)
我正在使用ggplot2制作直方图。目标是在一个图形中结合负和正两侧的累积直方图。我可以轻松地分别为负和正两侧绘制直方图,但一旦将它们合并,就变得混乱不堪。
示例数据:
df <- structure(list(NEG = c(-42.962, -1.86, -13.275, -56.188, -2.25,
-12.199, -3.953, -13.309, -4.512, -11.461, -19.813, -54.311,
-59.934, -7.045, -14.44, -40.829, -143.034, -233.009, -70.72,
-5.578), POS = c(180.328, 290.809, 156.894, 31.414, 629.74, 590.672,
268.89, 69.618, 415.007, 138.444, 10.139, 20.565, 106.027, 69.129,
19.809, 8.22, 53.711, 36.035, 11.694, 12.705)), .Names = c("NEG",
"POS"), row.names = c(NA, 20L), class = "data.frame")
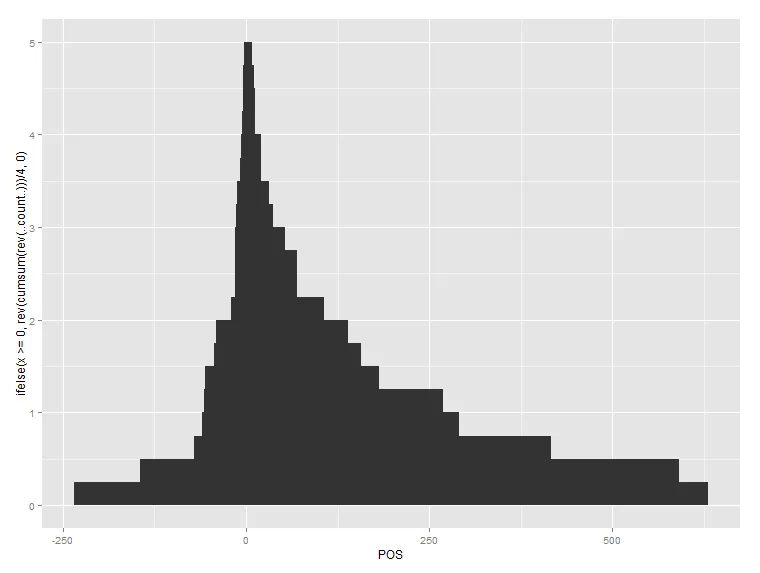
正面的代码有效:
ggplot(df)+
      geom_histogram(aes(x= POS, y=rev(cumsum(rev(..count..)))/4),binwidth=1)
负面的代码也可以起作用:
ggplot(df)+
      geom_histogram(aes(x= NEG, y=cumsum(..count..)/4),binwidth=1)
但是将这两个层次结合起来会产生混乱:
ggplot(df)+
      geom_histogram(aes(x= POS, y=rev(cumsum(rev(..count..)))/4),binwidth=1)+
      geom_histogram(aes(x= NEG, y=cumsum(..count..)/4),binwidth=1)
希望你能帮助我!
非常感谢!