这个解决方案的基本思路是:
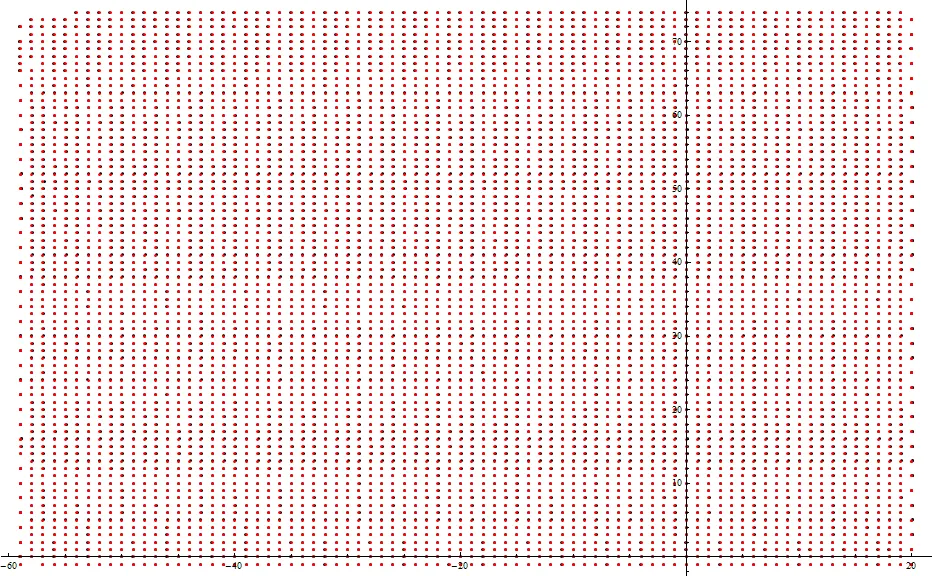
- 所有点似乎都位于一个格子上,但它并不是一个精确的正方形格子(它是倾斜的)
- 因此,让我们找到该格子的基向量,然后所有(大多数?)点将近似为基向量的整数线性组合
- 沿着基向量的整数“坐标”将是 OP 矩阵的矩阵索引
(OP 向我发送了数据文件,其中包含 {x,y} 点坐标。)
读取数据:
data = Import["xy.txt", "Table"]
找到每个点最近的四个点,并注意它们水平和垂直方向上的距离大约为5:
nf = Nearest[data]
In:=
Out= {{0., 0.}, {-4.995, 0.}, {5.003, 0.001}, {-0.021, 5.003}, {0.204, -4.999}}
ListPlot[nf[data[[100]], 5], PlotStyle -> Red,
PlotMarkers -> Automatic, AspectRatio -> Automatic]
生成相邻点之间的差异向量,仅保留长度约为5的向量。
vv = Select[
      Join @@ Table[(# - data[[k]] & /@ nf[data[[k]], 5]), {k, 1, Length[data]}],
      4.9 < Norm[#] < 5.1 &
     ];
把向量沿着它们可以指向的方向平均化,并保留两个“好”的向量(指向“上”或“右”)。
In:= Mean /@ GatherBy[vv, Round[ArcTan @@ #, 0.25] &]

Out= {{0.0701994, -4.99814}, {-5.00094, 0.000923234}, {5.00061, -4.51807*10^-6},
      {-4.99907, -0.004153}, {-0.0667469, 4.9983}, {-0.29147, 4.98216}}

In:= {u1, u2} = %[[{3, 5}]]

Out= {{5.00061, -4.51807*10^-6}, {-0.0667469, 4.9983}}
使用一个随机点作为起点,这样基向量u1和u2上的坐标将是整数:
translatedData = data[[100]] -
让我们找到整数坐标并看看它们有多好(距离实际整数有多远):
In:= integerIndices = LinearSolve[Transpose[{u1, u2}],
In:= Max[Abs[integerIndices - Round[integerIndices]]]
Out= 0.104237
In:= ListPlot[{integerIndices, Round[integerIndices]}, PlotStyle -> {Black, Red}]
所有点都接近于整数近似值。
将整数坐标偏移,使它们都为正,可以用作矩阵索引,然后将元素收集到矩阵中。我将坐标放在一个point对象中,以免混淆SparseArray:
offset = Min /@ Transpose[Round[integerIndices]]
offset = {1, 1} - offset
result =
SparseArray[
Thread[(# + offset & /@ Round[integerIndices]) -> point @@@ data]]
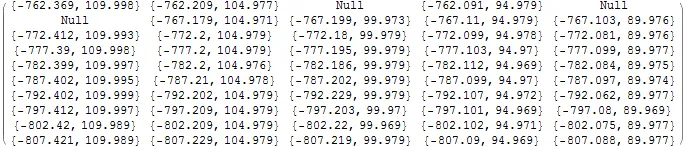
result = Normal[result] /. {point -> List, 0 -> Null}
最终,我们得到了一个矩阵result,每个元素是一个坐标对!(这里我用0 -> Null表示缺失的元素,这样做有些马虎:重要的是data中没有确切的0。)
MatrixForm[result[[1 ;; 10, 1 ;; 5]]]
编辑
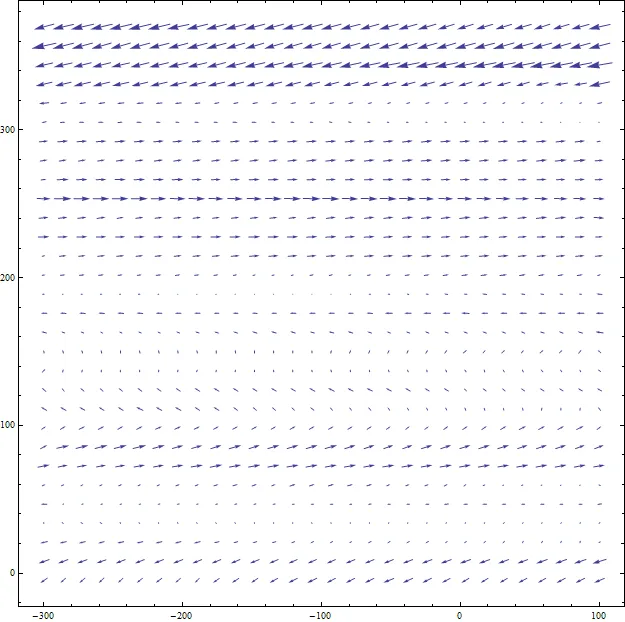
只是为了好玩,让我们来看一下点的偏差,它们偏离了精确的整数格点:
lattice = #1 u1 + #2 u2 & @@@ Round[integerIndices];

delta = translatedData - lattice;
delta = # - Mean[delta] & /@ delta;

ListVectorPlot[Transpose[{lattice, delta}, {2, 1, 3}], VectorPoints -> 30]
z值的网格,那么这就是为了那个而做的很多工作……为什么不在{x,y,z}数据上使用Interpolation,然后使用生成的插值函数生成矩阵?您将能够使用ReliefImage或任何类似的功能绘制它。有什么好理由排除任何类型的插值吗?由于晶格不是完全正方形,因此我下面的答案也引入了扭曲。 - Szabolcs