我想知道如何使用Python来计算图像的梯度。梯度包括x和y方向。我希望得到图像的x梯度图和y梯度图。有人能告诉我怎么做吗?
谢谢~
我想知道如何使用Python来计算图像的梯度。梯度包括x和y方向。我希望得到图像的x梯度图和y梯度图。有人能告诉我怎么做吗?
谢谢~
我认为你的意思是:
import numpy as np
from scipy import ndimage
import matplotlib.pyplot as plt
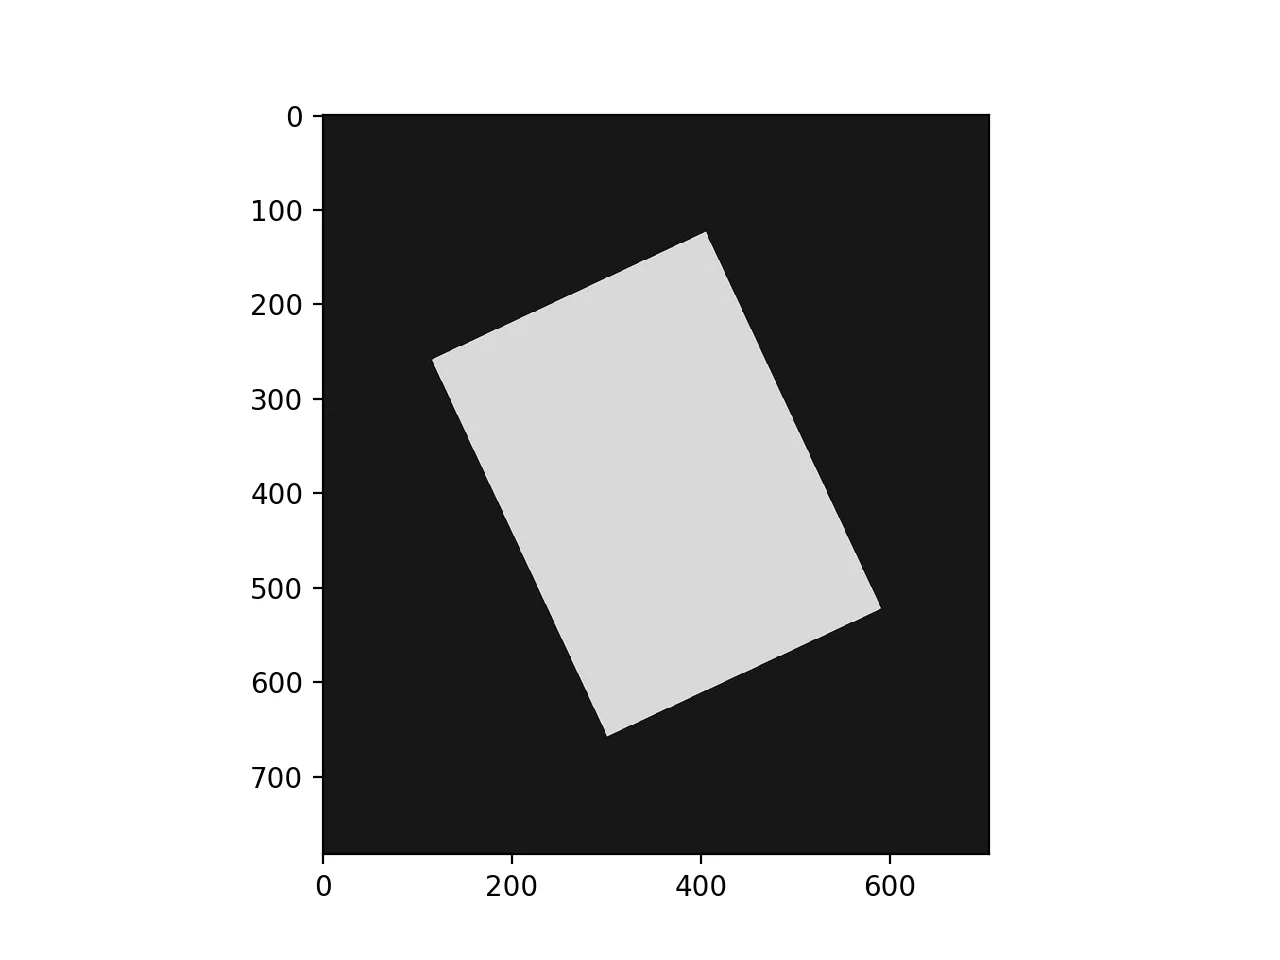
# Create a black image
img=np.zeros((640,480))
# ... and make a white rectangle in it
img[100:-100,80:-80]=1
# See how it looks
plt.imshow(img,cmap=plt.cm.gray)
plt.show()

# Rotate it for extra fun
img=ndimage.rotate(img,25,mode='constant')
# Have another look
plt.imshow(img,cmap=plt.cm.gray)
plt.show()
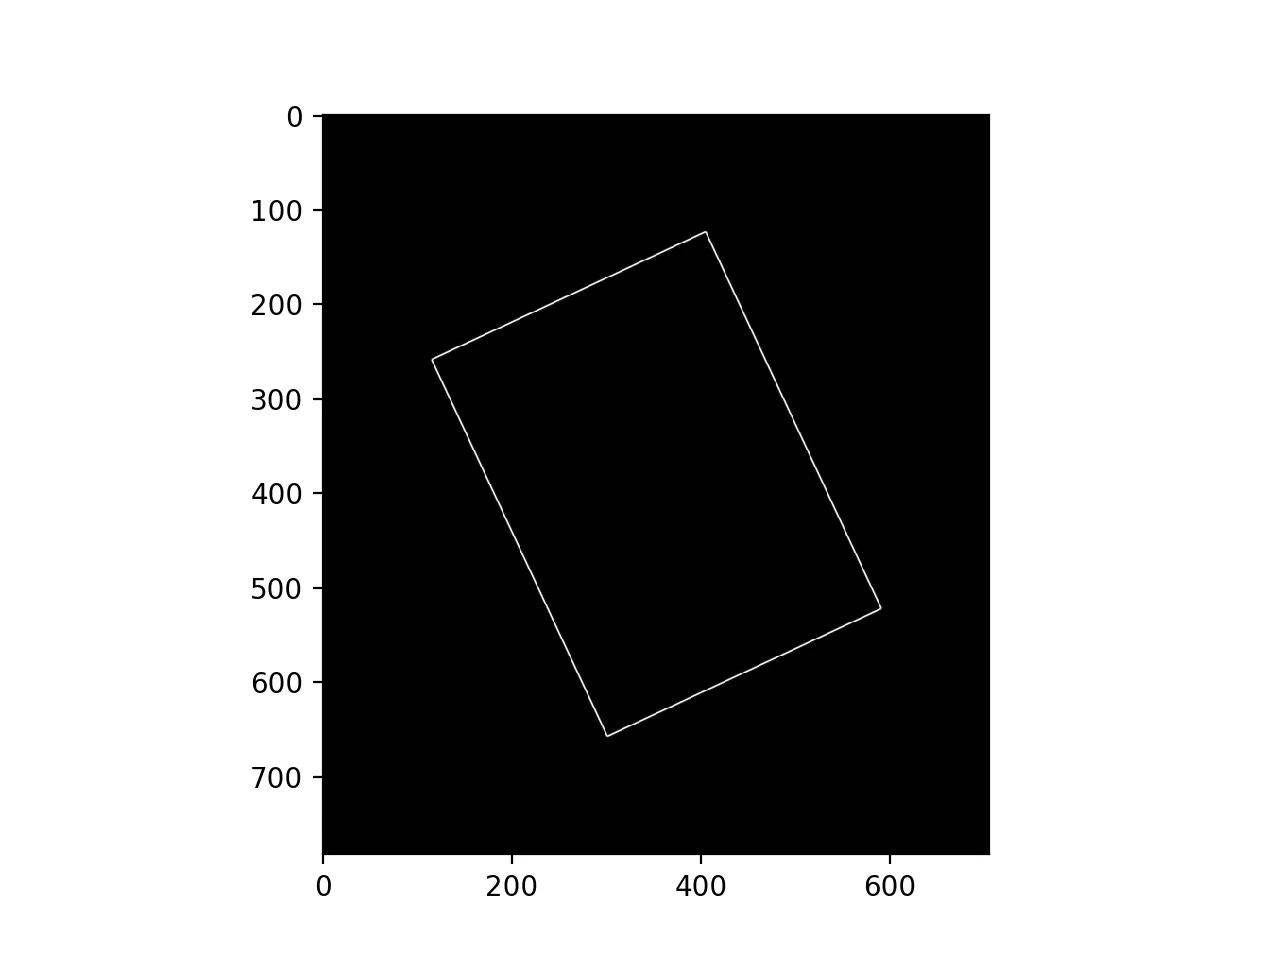
# Get x-gradient in "sx"
sx = ndimage.sobel(img,axis=0,mode='constant')
# Get y-gradient in "sy"
sy = ndimage.sobel(img,axis=1,mode='constant')
# Get square root of sum of squares
sobel=np.hypot(sx,sy)

# Hopefully see some edges
plt.imshow(sobel,cmap=plt.cm.gray)
plt.show()
或者您可以自己定义x和y梯度卷积核并调用convolve()函数:
# Create a black image
img=np.zeros((640,480))
# ... and make a white rectangle in it
img[100:-100,80:-80]=1

# Define kernel for x differences
kx = np.array([[1,0,-1],[2,0,-2],[1,0,-1]])
# Define kernel for y differences
ky = np.array([[1,2,1] ,[0,0,0], [-1,-2,-1]])
# Perform x convolution
x=ndimage.convolve(img,kx)
# Perform y convolution
y=ndimage.convolve(img,ky)
sobel=np.hypot(x,y)
plt.imshow(sobel,cmap=plt.cm.gray)
plt.show()
ValueError: Unsupported dtype。 - Raphael Royer-Rivardsobel中加入np.float64(),这对我解决了一个非常类似的问题。 - Tom Bush你可以使用OpenCV计算x和y梯度,如下所示:
import numpy as np
import cv2

img = cv2.imread('Desert.jpg')

kernely = np.array([[1,1,1],[0,0,0],[-1,-1,-1]])
kernelx = np.array([[1,0,-1],[1,0,-1],[1,0,-1]])
edges_x = cv2.filter2D(img,cv2.CV_8U,kernelx)
edges_y = cv2.filter2D(img,cv2.CV_8U,kernely)

cv2.imshow('Gradients_X',edges_x)
cv2.imshow('Gradients_Y',edges_y)
cv2.waitKey(0)
import matplotlib.pylab as plt
from skimage.io import imread
from skimage.color import rgb2gray
from skimage import filters
im = rgb2gray(imread('../images/cameraman.jpg')) # RGB image to gray scale
plt.gray()
plt.figure(figsize=(20,20))
plt.subplot(221)
plt.imshow(im)
plt.title('original', size=20)
plt.subplot(222)
edges_y = filters.sobel_h(im)
plt.imshow(edges_y)
plt.title('sobel_x', size=20)
plt.subplot(223)
edges_x = filters.sobel_v(im)
plt.imshow(edges_x)
plt.title('sobel_y', size=20)
plt.subplot(224)
edges = filters.sobel(im)
plt.imshow(edges)
plt.title('sobel', size=20)
plt.show()
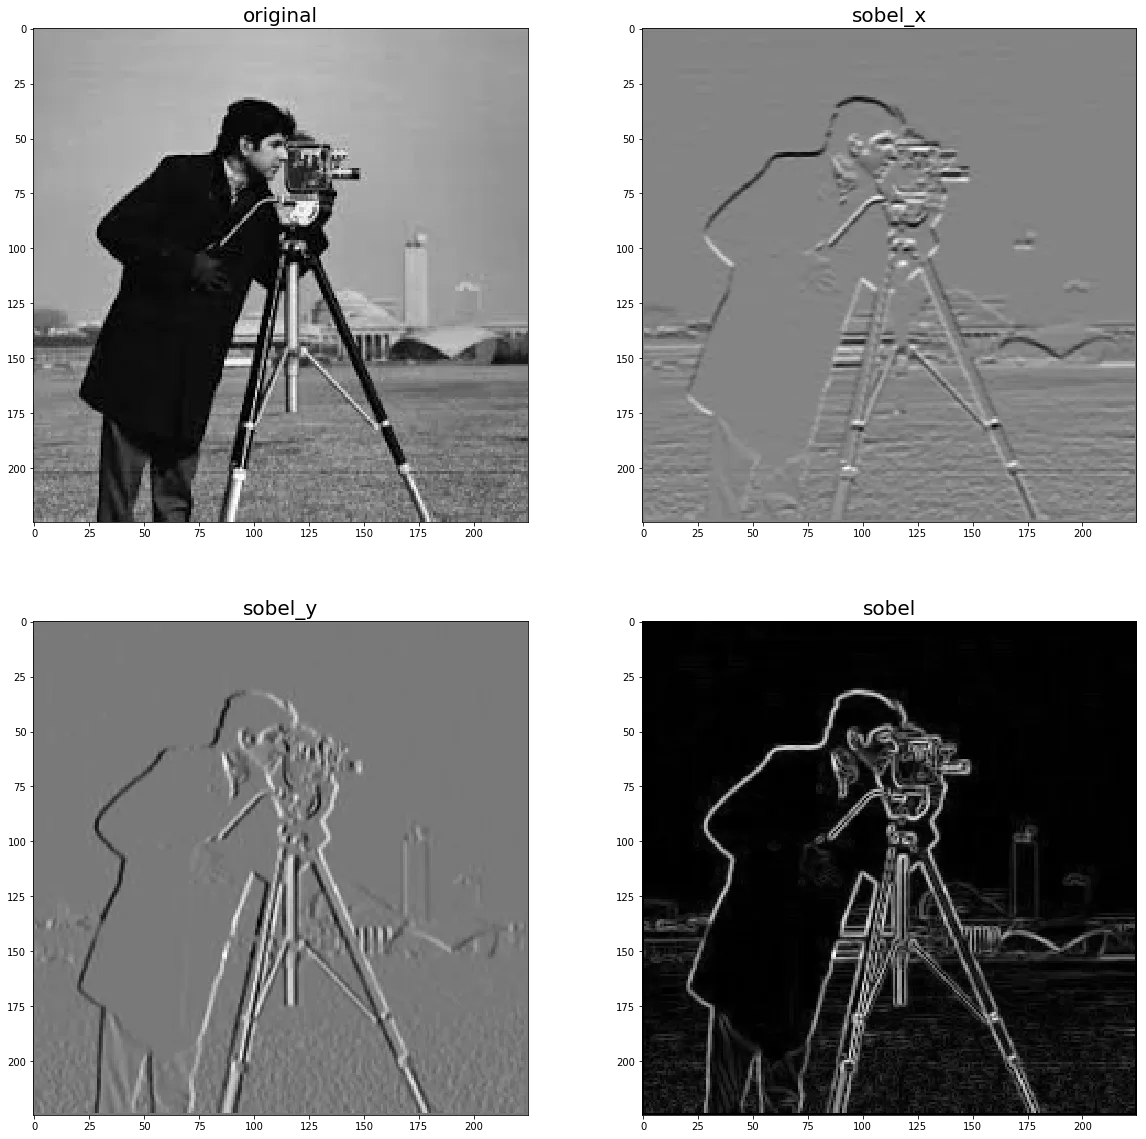
edges_y = filters.sobel_h(im) , edges_x = filters.sobel_v(im)。这是因为sobel_h找到的是水平的边缘,是通过y方向的导数发现的。你可以看到sobel_h算子使用的卷积核是在y方向上进行导数运算的。 - Ryan Marten