在SVG中画一个“波浪线”

6
我正在尝试找出如何在任意SVG path元素上画波浪线。该路径是由React组件生成的。例如,我正在尝试复制此问题中的线条:

Squiggly Line Example

在SVG和/或JavaScript生成的路径中有没有简单的方式实现这一点?
我考虑使用s路径命令连接一系列曲线,但那样我就需要计算沿着曲线的点。我还考虑了某种位移滤镜,但我不确定从哪里开始。

3
一直喝啤酒,直到视物有些扭曲。 - Reactgular
哈哈。可能行...让我试试看。 - will-hart
3个回答

13

我认为最简单的方法是沿着路径一步步前进。然后,在每个步骤中,插入一个二阶贝塞尔曲线,其控制点位于两个端点之间且垂直于曲线的中心位置。然后在下一个步骤中,切换控制点所在的侧面。

function makeSquiggle(squigglePathId, followPathId, squiggleStep, squiggleAmplitude)
{
  var followPath = document.getElementById(followPathId);
  var pathLen = followPath.getTotalLength();

  // Adjust step so that there are a whole number of steps along the path
  var numSteps = Math.round(pathLen / squiggleStep);

  var pos = followPath.getPointAtLength(0);
  var newPath = "M" + [pos.x, pos.y].join(',');
  var side = -1;
  for (var i=1; i<=numSteps; i++)
  {
    var last = pos;
    var pos = followPath.getPointAtLength(i * pathLen / numSteps);

    // Find a point halfway between last and pos. Then find the point that is
    // perpendicular to that line segment, and is squiggleAmplitude away from
    // it on the side of the line designated by 'side' (-1 or +1).
    // This point will be the control point of the quadratic curve forming the
    // squiggle step.
    
    // The vector from the last point to this one
    var vector = {x: (pos.x - last.x),
                  y: (pos.y - last.y)};
    // The length of this vector
    var vectorLen = Math.sqrt(vector.x * vector.x + vector.y * vector.y);
    // The point halfwasy between last point and tis one
    var half = {x: (last.x + vector.x/2),
                y: (last.y + vector.y/2)};
    // The vector that is perpendicular to 'vector'
    var perpVector = {x: -(squiggleAmplitude * vector.y / vectorLen),
                      y: (squiggleAmplitude * vector.x / vectorLen)};
    // No calculate the control point position
    var controlPoint = {x: (half.x + perpVector.x * side),
                        y: (half.y + perpVector.y * side)};
    newPath += ("Q" + [controlPoint.x, controlPoint.y, pos.x, pos.y].join(','));
    // Switch the side (for next step)
    side = -side;
  }
  var squigglePath = document.getElementById(squigglePathId);
  squigglePath.setAttribute("d", newPath);
}


makeSquiggle("squiggle", "follow", 25, 20);
#follow {
  fill: none;
  stroke: grey;
  stroke-width: 2;
}

#squiggle {
  fill: none;
  stroke: red;
  stroke-width: 2;
}
<svg width="500" height="400">
  <path id="follow" d="M 50,300 C 100,100 300,0, 350,250 L 450,200"/>
  <path id="squiggle" d="M0,0"/>
</svg>


1
非常好的答案,谢谢。为了在React中使其工作而不必先渲染SVG节点,我能够使用svg-path-properties npm包。 - will-hart

3

类似于函数的解决方案

在曲线上绘制cos(x)

注意:f(x)是您想要绘制的波浪线应遵循的曲线,x0是您开始绘制波浪线的位置,xn是您结束绘制的位置。本示例假设f(x)在x0和xn之间不断增长。

如果您有一条光栅化曲线,并且想要绘制的波浪线是cos(x),则可以按照以下方法找到绘制该线所需的点:

  • 波浪线:您想要绘制的线
  • 曲线:波浪线应遵循的曲线
  • point0:曲线起始点
  • pointN:曲线中x == N的点
  • lenN:从point0pointN的曲线长度
  • h(在图像中)是pointN曲线波浪线之间的距离,为cos(lenN)
  • alphaN:曲线在x == n处的切线与x轴之间的角度
  • a(在图像中)为-cos(alphaN)
  • b(在图像中)为sin(alphaN)
  • squigglyPointNpointN.x + a, pointN.y + b

  'use strict'
  //
  // point = [int, int], point[0] = x, point[1] = y
  // rasterizedCurve = [point0, ...,pointN]
  //

  // int -> [int,...,int]
  function rangeFrom1ToN(N) {
    return Array(N).fill(0).map((x, index) => index).slice(1);
  }

  // [int, ...,int] -> [float, ..., float]
  function expandRange(Range, precision) {
    return Range.map(x => rangeFrom1ToN(precision).map((y, index) => x + 1/precision * index))
                .reduce((acc, val) => acc.concat(val));
  }

  function formatForSvg(points) {
    return points.map(x => x.toString()).reduce((acc, val) =>  {return acc + ' ' + val})
  }

  // rasterizedCurve, index -> int
  function derivative(curve, index){
    //
    // return dx' curve(x)
    //
    if (index === 0) {
        return 0;
    }
    const point1 = curve[index - 1];
    const point2 = curve[index];
    return (point2[1] - point1[1]) / (point2[0] - point1[0]);
  }

  // rasterizedCurve -> rasterizedCurve
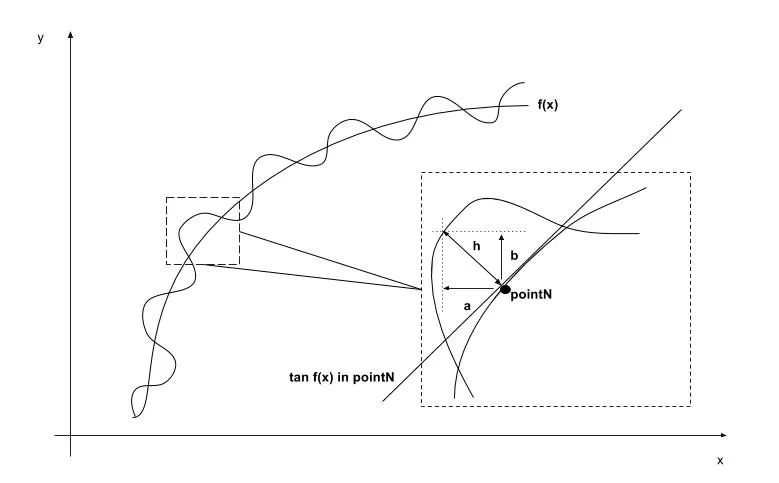
  function squiggleAroundCurve(x, y, curve, index) {
    const len = lenCurve(curve, index);
    const h = Math.sin(len);

    const b = Math.sin(Math.atan2(1, derivative(curve, index))) * h;
    const a = Math.cos(Math.atan2(1, derivative(curve, index))) * h;

    x -= a;
    y += b;
    return [x, y];
  }

  function pow2(x) {
    return Math.pow(x,2);
   }
    function dist(point1, point2) {
    return Math.sqrt(pow2(point2[0] - point1[0]) + pow2(point2[1] - point1[1]))
  }

  // rasterizedCurve, int -> int
  function lenCurve(rasterizedCurve, index) {
    const curve = rasterizedCurve.slice(0, index);
    return curve.reduce((sum, point, index) => {
      let len = 0;
      if (index > 0) {
        len = dist(point, curve[index - 1]);
      }
        return sum + len;
    }, 0);
  }


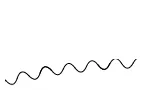
  const Curve = expandRange(rangeFrom1ToN(90),50).map(x => [x, (Math.log(x) * 15)]);
  const SquiggledCurve = Curve.map((point, index) => squiggleAroundCurve(point[0], point[1], Curve, index))
  function zoom(curve, w) {
    return curve.map(point => [point[0] * w, point[1] * w]);
  }
  function getNode(n, v) {
    n = document.createElementNS("http://www.w3.org/2000/svg", n);
    for (var p in v)
      n.setAttributeNS(null, p.replace(/[A-Z]/g, function(m, p, o, s) { return "-" + m.toLowerCase(); }), v[p]);
    return n
  }

  var svg = getNode("svg");

  setTimeout(function() {
    document.body.appendChild(svg);
    const r = getNode('polyline', { points:formatForSvg(zoom(SquiggledCurve, 10)), fill:'none', stroke:'black'});
    const c = getNode('polyline', { points:formatForSvg(zoom(Curve, 10)), fill:'none', stroke:'black'});
    svg.appendChild(r);
    svg.appendChild(c);
  }, 1000);
  svg {
    width: 1100px;
    height: 900px;
  }


2

最好的方法可能是只需连接贝塞尔曲线,然后偏移并反转每个后续曲线的值,直到达到所需长度。


是的,根据样式需求,可以选择顺序三次贝塞尔曲线或二次曲线。 :-) - markE
我想这里的挑战是我需要手动计算沿路径的点。这并不是不可能的,只是我希望有更简单的方法! - will-hart

网页内容由stack overflow 提供, 点击上面的
可以查看英文原文,
原文链接