在节点组周围画一个圆形。

4
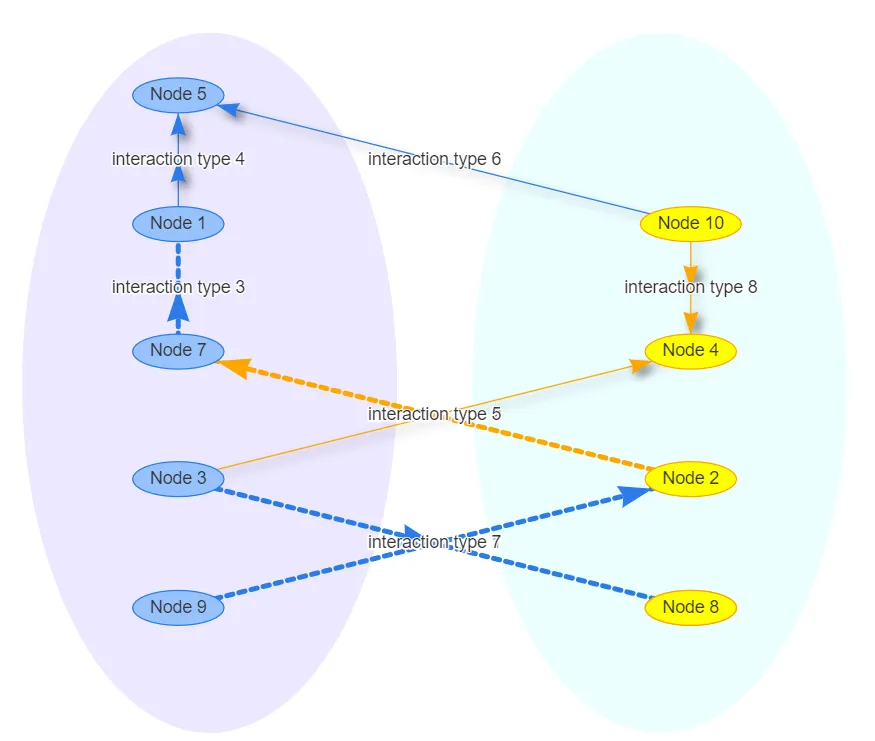
在以下的vis-network中,我有两组节点。通过访问生成的layput_as_tree后的节点位置,我将这两组节点分开成左侧和右侧。现在我想在节点组周围画一个圆形或椭圆形。 这是一个可重现的例子。
require(shiny)
require(visNetwork)
server <- function(input, output) {
  output$network <- visNetwork::renderVisNetwork({
    edges <- data.frame(
      from = sample(1:10, 8),
      to = sample(1:10, 8),
      label = paste("interaction type", 1:8),
      length = c(100, 500),
      width = c(4, 1),
      arrows = c("to", "from", "middle", "middle;to"),
      dashes = c(TRUE, FALSE),
      title = paste("interaction name", 1:8),
      smooth = c(FALSE, TRUE),
      shadow = c(FALSE, TRUE, FALSE, TRUE)
    )
    nodes <- data.frame(
      id = 1:10,
      group = c("A", "B"),
      label = paste("Node", 1:10),
      shape = "ellipse"
    )

    # save the graph in variable
    g <-
      visNetwork::visNetwork(nodes, edges, height = "500px", width = "100%") %>% 
      visNetwork::visIgraphLayout(layout = "layout_as_tree")

    # access the x and y co-ordinates to arrange the groups
    coords <- g$x$nodes %>%
      dplyr::mutate(x = abs(x)) %>%
      dplyr::mutate(y = abs(y)) %>%
      dplyr::mutate(x = ifelse(group %in% "A", -x, x)) %>%
      dplyr::select(x, y) %>%
      as.matrix()

    #' replot the network with the new co-ordinates
    visNetwork::visNetwork(nodes, edges, height = "500px", width = "100%") %>%
     visNetwork::visIgraphLayout(
      layout = "layout.norm",
      layoutMatrix = coords,
      randomSeed = 1,
      smooth = T
    ) 
  })
}

ui <- shiny::fluidPage(
  visNetwork::visNetworkOutput("network",
    width = "1000px", height = "700px"
  )
)

shiny::shinyApp(ui = ui, server = server)

我不太确定:您实现的东西(上一张图片)看起来并不像您所要求的?现在有什么问题? - Christoph
“programmatically to get the x and y closer to my picture 2”是什么意思?是指某种算法吗? - Christoph
我建议您先在这里 https://dev59.com/EG445IYBdhLWcg3wH2vH 查看一下。然后,当您清楚需要什么时,再开一个新的问题。 - Christoph
已经有不同的算法可以做到这一点 - 参见我的链接。为什么你需要其他的东西呢?"看起来好"是什么意思?在你的情况下,与现有算法有何不同? - Christoph
1
这取决于你使用的“画布”是什么...如果你是指网页作为“画布”,那么你可以使用CSS border-radius属性将元素剪切成圆形。如果你正在使用HTML5 canvas标签,那就有点不同了。天啊!你赢了!我很高兴你搞清楚了。我本来打算制作随机生成的点来演示这个概念。 - Shmack
显示剩余15条评论
2个回答

1
使用visEvents并传递Javascript代码,能够生成节点组周围的圆形。
graph %>%
    visNetwork::visEvents(type = "on", beforeDrawing = "function(ctx) {
    ctx.fillStyle = 'rgba(255, 0, 255, 0.1)';
    ctx.ellipse(-180 , 25, 150, 280 , 0, 0, 2 * Math.PI);
    ctx.fill();
    ctx.fillStyle = 'rgba(64, 255, 255,0.1)';
    ctx.ellipse(180 , 25, 150, 280, 0, 0, 2 * Math.PI);
    ctx.fill();
}")

enter image description here


1

我正在完成脚本,但是我必须离开...会回来完成。

//The nodeGraph variable should probably be ran through a transitive
//closure algorithm to simiplify it, so its not an overly complicated
//network
nodeGraph = {};


//create nodes and the beginnings of a dictionary for a directed graph
//to later be used to adjust the positions of nodes - note this is not
//the most efficient algorithm.

nodeCount = 10;

for (var i = 0; i < nodeCount; i++)
{
  var div = document.createElement('div');
  div.id = "node" + i;
  div.className = "node";
  div.setAttribute("group", (randomInt(1, 2) == 1) ? "A" : "B")
  nodeGraph["node" + i] = [];
  document.getElementsByClassName('container')[0].append(div);
}

//here I randomly create a relationship amongst nodes - but I limit it to 5 relationships just so its not too resource heavy.

//loop through each node
for (var i = 0; i < nodeCount; i++)
{
  //generate number of relationships
  randInt = randomInt(1, 5);
  
  //generate random relationships
  for (var j = 0; j < randInt; j++)
  {
    ranNum = randomInt(0, nodeCount - 1);
    //console.log(ranNum);
    while (nodeGraph["node" + i].includes(ranNum))
    {
      ranNum = randomInt(0, nodeCount - 1);
    }
    //console.log(ranNum);
    nodeGraph["node" + i].push("node" + ranNum);
  }
}

//outputs the random relationship amongst nodes
console.log(nodeGraph);

//the above code sets up the problem for what we want to achieve
//which is to essentially sort the nodes into the two "cells"

//lets get the location of the parent cells and a reference to them
groupABox = document.getElementById('GroupA');
groupABBox = groupABox.getBoundingClientRect();
groupBBox = document.getElementById('GroupB');
groupBBBox = groupBBox.getBoundingClientRect();
//then loop through every node and stick them into their respective groups
for (var i = 0; i < nodeCount; i++)
{
  currentNode = document.getElementById("node" + i);
  group = currentNode.getAttribute('group');
  if (group == 'A')
  {
    relationships = nodeGraph['node' + i];
    for (var j = 0; j < relationships.length; j++)
    {
      comparedNode = document.getElementById(relationships[j]);
      if (comparedNode.getAttribute('group') == 'A')
      {
      }
      else
      {
      }
    }
  }
}

function randomInt(min, max)
{ 
  return Math.floor(Math.random() * (max - min + 1) + min);
}
.parentNode
{
  border-radius: 100px;
  border: solid black 5px;
  height: 500px;
  width: 200px;
  position: relative;
  background-color: lightblue;
}

#GroupA
{
  float: left;
}

#GroupB
{
  float: right;
}

.node
{
  height: 20px;
  width: 20px;
  position: absolute;
  float: none;
  background-color: green;
}
<div class="container">
  <div id="GroupA" class="parentNode">
  </div>
  <div id="GroupB" class="parentNode">
  </div>
</div>

https://jsfiddle.net/Shmac/x1wf52ba/1/


我解决了圆形问题并更新了Q。您介意删除旧评论吗?因为我们的讨论是关于圆形的,这样不会让读者感到困惑。谢谢。 - user5249203
是的。我想说的是,由于在画布上绘制圆形首先需要创建一个对象 - 具体来说,是一个“上下文”,因此纯粹的JavaScript无法解决圆形问题。这样的东西应该是Shiny本身就具备的。当您尝试在创建点之后绘制圆时,原始上下文会被新创建的上下文替换。我也应该删除我的答案吗?不幸的是,我预见它不会有用。我必须付出很多努力才能生成仅连接到2个节点的节点,然后创建算法... - Shmack
当然,我之前不知道VisEvents是我们可以传递JS代码的地方。一旦我明白了这一点,我所做的就是查看w3 schools关于在画布上绘制圆形的教程,因为visnetwork是显示在画布上的,这导致了解决方案。 - user5249203
1
很高兴你解决了它。抱歉我的回答没什么用,哈哈。 - Shmack

网页内容由stack overflow 提供, 点击上面的
可以查看英文原文,
原文链接