我有两个MATLAB信号,例如
a = randn(1,1e6);
b = randn(1,1e6);
我正在寻找它们之间的相关性如下:
R=corrcoef(a,b);
r = R(2,1);
现在每次运行我的代码时,相关系数都是不同的。我甚至尝试增加样本数量(从1e6增加到更高的值),但这并没有起作用。是否有其他方法可以找到这些信号之间的相关系数?
我有两个MATLAB信号,例如
a = randn(1,1e6);
b = randn(1,1e6);
我正在寻找它们之间的相关性如下:
R=corrcoef(a,b);
r = R(2,1);
现在每次运行我的代码时,相关系数都是不同的。我甚至尝试增加样本数量(从1e6增加到更高的值),但这并没有起作用。是否有其他方法可以找到这些信号之间的相关系数?
a和b)。这些信号是随机过程的实现(在你的情况下是白色高斯过程,因为你使用randn)。1e6),结果(样本相关系数)就会越集中在0(理论相关系数)周围。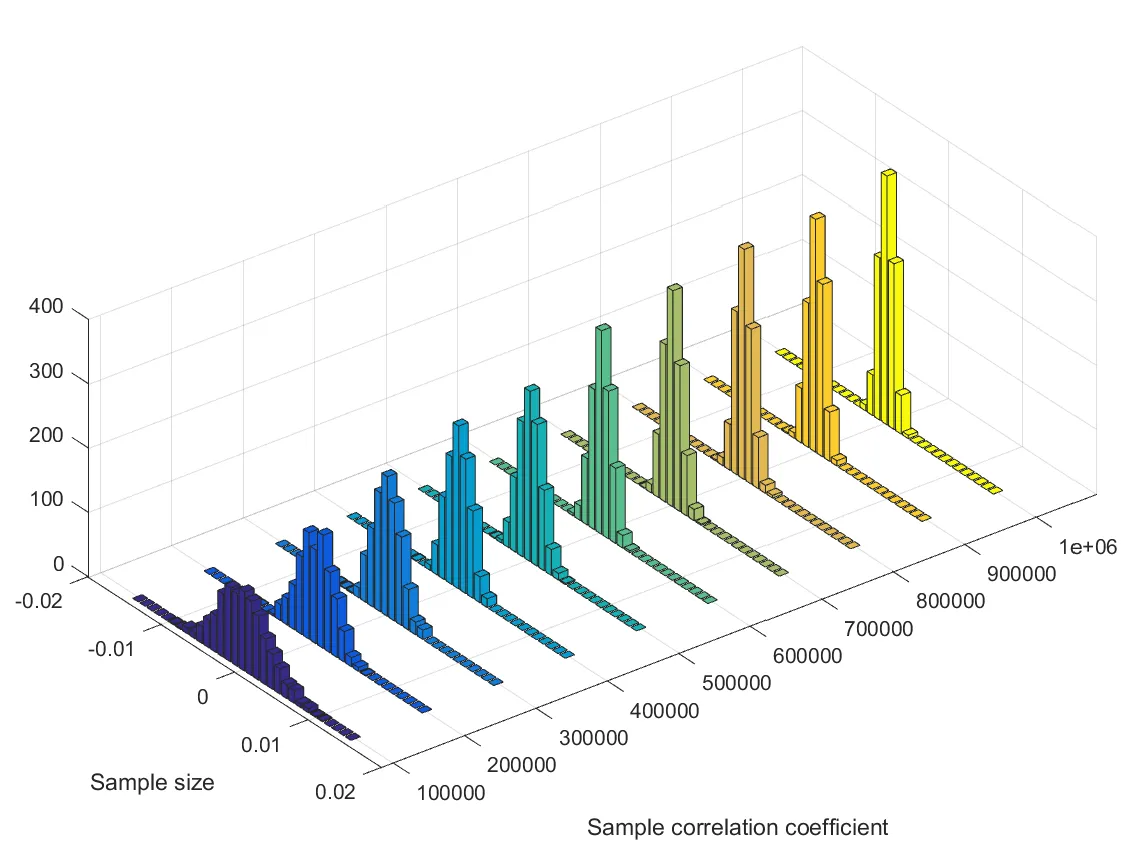
S = 1e5:1e5:1e6; %// sample sizes
N = 1000; %// number of repetitions to generate histogram
binlimits = [-.015 .015]; %// set manually depending on S
B = 31; %// number of bins in the histogram
stretch = 7; %// stretch factor for plotting the histograms
result = NaN(numel(S),B); %// preallocate
for m = 1:numel(S)
    cc = NaN(1,S(m));
    for n = 1:N
        a = randn(1,S(m));
        b = randn(1,S(m));
        c = corrcoef(a,b);
        cc(n) = c(2,1); %// correlation coefficient
    end
    [hist, edges] = histcounts(cc,31,'BinLimits',binlimits,'Normalization','pdf');
    result(m,:) = hist; %// histogram of correlation coefficient for this sample size
end
bins = (edges(1:end-1) + edges(2:end))/2; %// axis for plotting the histograms
resultbar = NaN(numel(S)*stretch,B);
resultbar(1:stretch:end,:) = result; %// separate the histograms for better visualization
h = bar3(bins, resultbar.'); %'// plot histograms
set(gca,'xtick',1:stretch:numel(h),'xticklabels',S)
delete(h(mod(0:numel(h)-1,stretch)>0)) %// remove zeros
xlabel('Sample correlation coefficient')
ylabel('Sample size')
randn 的程序设计方式不会每次调用都生成相同的结果。如果您希望在每次调用脚本时为变量 a 和 b 生成相同的随机数集,您需要通过设置随机生成器来告诉 Matlab。
我编写了一个名为 test 的小函数,并嵌套使用了函数 call_randn 来演示这一点。test 调用了随机生成器3次,你会发现它会为所有3次调用生成相同的 r。然而,每次您调用 test 这些数字都将是不同的。
%// test
function r = test()
    rng('default')  %// Initialise random generator.
    sa = rng;       %// Store current generator settings in sa.
    rng('shuffle')  %// Get new generator settings.
    sb = rng;       %// Store new generator settings in sb.
    n = 10;         %// Number of random numbers to be generated.

    for i = 1:3
        [a(i,1:n),b(i,1:n)] = call_randn(sa,sb,n);
        R=corrcoef(a,b);
        r(i) = R(2,1);
    end
end

function [a,b] = call_randn(sa,sb,n)
    rng(sa);         %// Load generator settings.
    a = randn(1,n);
    rng(sb);
    b = randn(1,n);
end
s = rng;
r = randn(1,5)
r =
-0.0245   -1.9488    1.0205    0.8617    0.0012
rng(s);
r1 = randn(1,5)
r1 =
-0.0245   -1.9488    1.0205    0.8617    0.0012
- 你会计算一个经验性的“插入术语”,而不是理论上的(请记住,如果你从数据中计算某些东西,你永远不会计算理论上的东西)。
- 相关不是用那种方式计算的,你必须使用正确的公式:(参见“样本相关系数”)。
- BillBokeey1时,最大相似度被实现。但对于系数的其他值,我不确定实部或模数更有意义。我通常采用模数(绝对值)。 - Luis Mendo