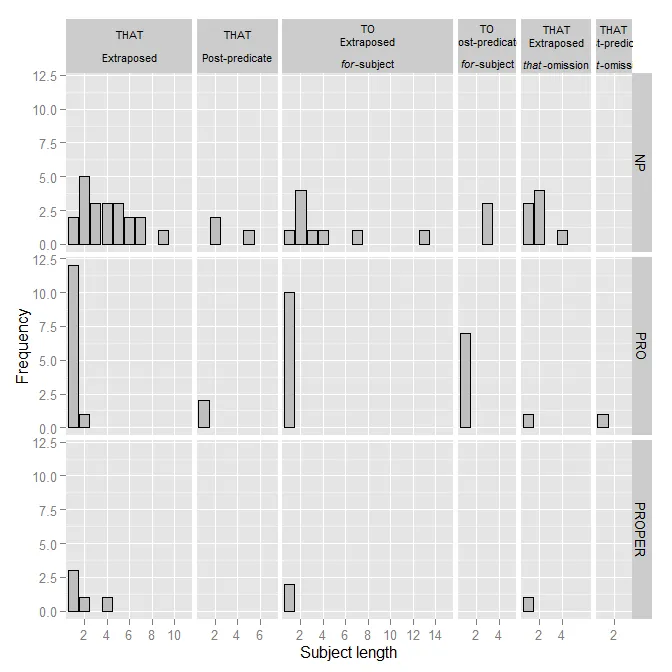
我在使用 facet 标签中斜体字的时候遇到了问题。我使用下面的代码来创建标签的新行:
    levels(length_subject$CONSTRUCTION) <-
c("THAT \n Extraposed", "THAT \n Post-predicate", "TO \n Extraposed \n for-subject", "TO \n Post-predicate \n for-subject", "THAT \n Extraposed \n that-omission", "THAT \n Post-predicate \n that-omission")
然而,我希望“that”和“for”这两个词以斜体显示。我尝试过以下方式:
"TO \n Extraposed \n (italics(for))-subject"
它没有起作用。
这是图表的样子:
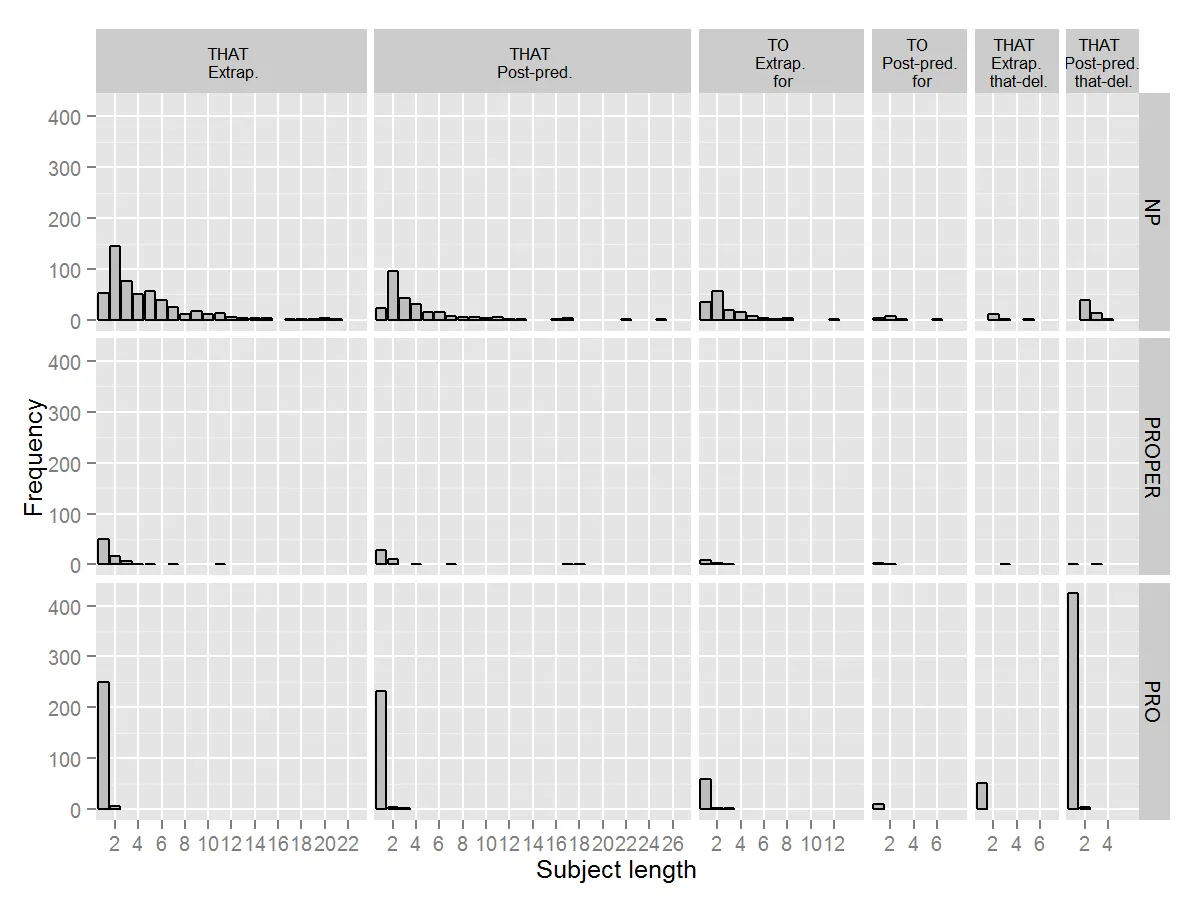
使用以下代码生成:
ggplot( length_subject, aes( x = SUBJECT ) ) +
  geom_histogram(binwidth=.6, colour="black", fill="grey") +
  ylab("Frequency") +
  xlab("Subject length") +
  scale_x_discrete(breaks=c(2,4, 6, 8, 10, 12, 14, 16, 18, 20, 22, 24, 26, 28, 30)) + #
  facet_grid( SUBJECT_TYPE~CONSTRUCTION, scales="free_x", space="free") +
  theme(strip.text.x = element_text(size = 8))
这是数据的简化版本:
structure(list(ID = structure(1:86, .Label = c("A05_122_01",
"A05_253_01", "A05_277_07", "A05_400_01", "A05_99_01", "A06_1076_01",
"A06_1261_01", "A06_1283_01", "A06_1283_02", "A06_1317_01", "A06_1326_01",
"A06_1389_01", "A06_1390_01", "A06_1437_01", "A06_1441_02", "A06_1441_03",
"A06_1442_03", "A06_1456_01", "A06_1461_01", "A06_830_01", "A06_868_01",
"A06_884_01", "A06_884_03", "A0K_1057_02", "A0K_1144_07", "A0K_1177_01",
"A0K_1190_03", "A0K_1214_03", "A0K_1216_01", "A0K_950_02", "A0K_986_01",
"A1A_102_02", "A1A_163_01", "A1A_199_01", "A1A_45_01", "A1A_97_01",
"A1B_1008_02", "A1B_1013_01", "A1B_1028_02", "A1B_1042_01", "A1B_1064_01",
"A1B_1126_03", "A1B_1152_01", "A1B_1174_01", "A1B_1271_01", "A1B_997_01",
"A1J_487_01", "A1J_544_02", "A1J_555_03", "A1J_569_01", "A1J_601_01",
"A1N_422_04", "A1N_70_02", "A1S_191_01", "A1S_329_01", "A1S_330_01",
"A1S_465_04", "A1Y_248_01", "A1Y_278_02", "A1Y_292_01", "A1Y_466_01",
"A1Y_521_01", "A1Y_612_01", "A1Y_634_01", "A26_139_03", "A26_142_01",
"A26_148_01", "A26_289_01", "A26_345_02", "A26_439_01", "A26_441_02",
"A26_463_01", "A28_171_01", "A28_244_01", "A28_245_01", "A28_30_01",
"A28_341_01", "A28_42_01", "A28_494_03", "A2A_301_01", "A2A_396_01",
"A2A_599_01", "A2A_637_01", "A2A_676_01", "A2E_22_01", "A2E_25_03"
), class = "factor"), SUBJECT = c(3L, 2L, 6L, 2L, 2L, 1L, 1L,
1L, 1L, 2L, 4L, 1L, 4L, 2L, 3L, 2L, 2L, 1L, 1L, 1L, 1L, 1L, 1L,
1L, 7L, 1L, 3L, 2L, 2L, 1L, 6L, 7L, 4L, 1L, 5L, 4L, 2L, 9L, 1L,
1L, 1L, 1L, 1L, 1L, 1L, 1L, 3L, 5L, 3L, 4L, 1L, 1L, 1L, 1L, 5L,
2L, 1L, 1L, 2L, 1L, 1L, 1L, 1L, 5L, 2L, 1L, 2L, 2L, 1L, 7L, 1L,
4L, 1L, 2L, 1L, 1L, 3L, 1L, 13L, 2L, 1L, 1L, 1L, 3L, 1L, 1L),
    CONSTRUCTION = structure(c(1L, 3L, 1L, 1L, 1L, 4L, 4L, 1L,
    1L, 5L, 5L, 1L, 1L, 5L, 1L, 3L, 5L, 1L, 5L, 4L, 3L, 3L, 1L,
    5L, 3L, 5L, 1L, 1L, 2L, 3L, 1L, 1L, 3L, 1L, 1L, 1L, 3L, 1L,
    4L, 3L, 1L, 3L, 1L, 1L, 1L, 1L, 4L, 2L, 4L, 1L, 1L, 3L, 2L,
    5L, 1L, 1L, 1L, 3L, 1L, 1L, 4L, 4L, 3L, 1L, 2L, 3L, 3L, 1L,
    3L, 1L, 1L, 1L, 6L, 1L, 1L, 2L, 4L, 4L, 3L, 5L, 3L, 3L, 3L,
    3L, 5L, 1L), .Label = c("THAT_EXT", "THAT_EXT_NT", "THAT_POST",
    "THAT_POST_NT", "TO_EXT_FOR", "TO_POST_FOR"), class = "factor"),
    SUBJECT_TYPE = structure(c(1L, 1L, 1L, 1L, 2L, 2L, 2L, 2L,
    2L, 1L, 1L, 2L, 1L, 1L, 1L, 1L, 1L, 2L, 1L, 2L, 2L, 2L, 2L,
    1L, 1L, 2L, 1L, 1L, 1L, 1L, 1L, 1L, 1L, 2L, 1L, 3L, 1L, 1L,
    2L, 3L, 1L, 2L, 2L, 3L, 1L, 3L, 1L, 1L, 1L, 1L, 2L, 2L, 2L,
    1L, 1L, 1L, 2L, 2L, 3L, 2L, 2L, 2L, 3L, 1L, 1L, 2L, 1L, 1L,
    2L, 1L, 2L, 1L, 2L, 1L, 2L, 2L, 1L, 2L, 1L, 1L, 2L, 2L, 2L,
    1L, 3L, 3L), .Label = c("NP", "PRO", "PROPER"), class = "factor")), .Names = c("ID",
"SUBJECT", "CONSTRUCTION", "SUBJECT_TYPE"), class = "data.frame", row.names = c(NA,
-86L))
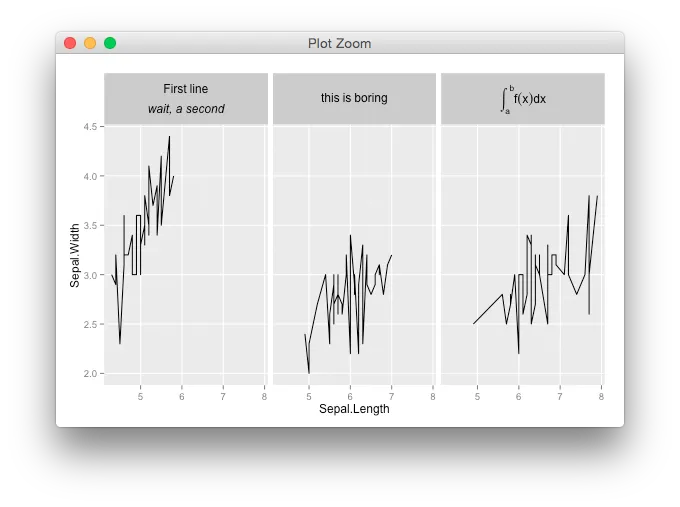
facet_grid内尝试使用labeller = label_parsed。不过不确定这会对你的新行产生什么影响。 - joranexpression()和换行符;通常的解决办法是使用atop。 - baptiste